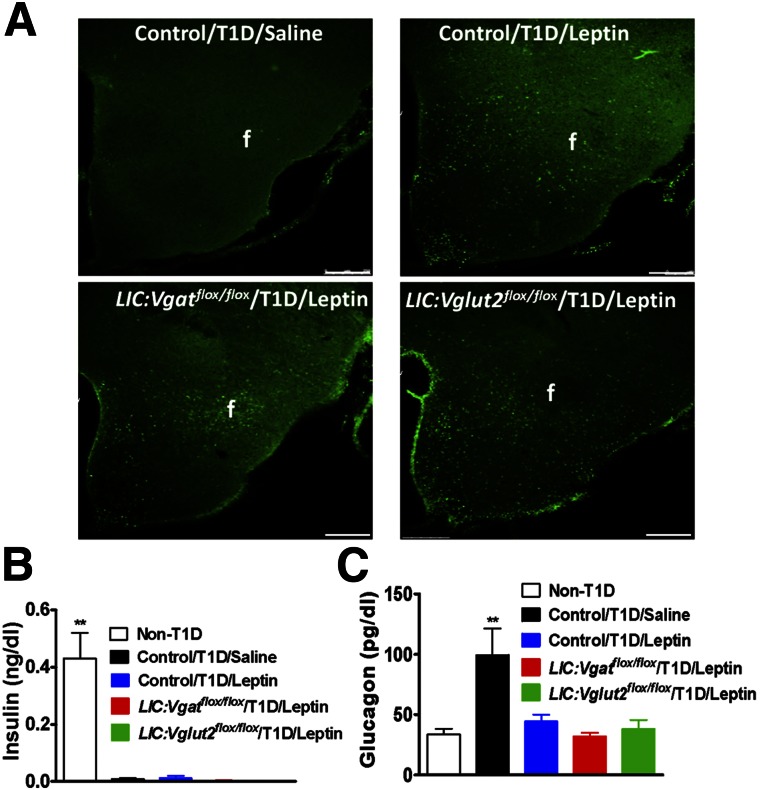
Figure 2.
Effects of central leptin infusion on glucagon levels in T1D LIC:Vgatflox/flox and LIC:Vglut2flox/flox mice. A: Expression of pSTAT3 in the hypothalamus of the indicated mouse groups. Scale bars = 250 μm. f, fornix. Plasma levels of insulin (B) and glucagon (C) were measured at day 13 of the experiment. All data are presented as the mean ± SEM. **P < 0.01 vs. the other groups (n = 4–7).

