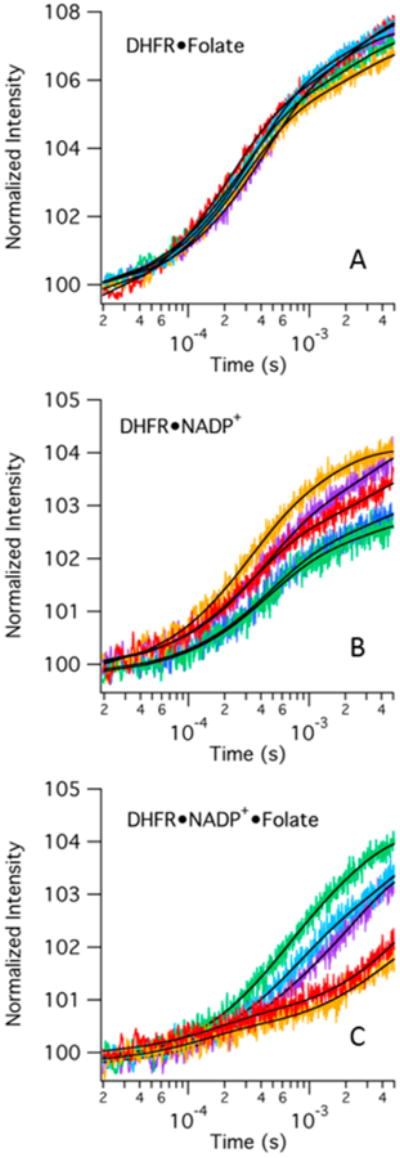
Figure 4.

Representative fluorescence temperature-jump transients of three DHFR complexes for a jump from 29 to 36 °C. Tryptophan fluorescence is excited at 280 nm and integrated from 327 to 353 nm. Colors refer to either folate or NADP+ concentrations: purple for 100 μM, blue for 125 μM, green for 150 μM, orange for 175 μM, and red for 200 μM: (A) 100 μM DHFR with varying folate concentrations, (B) 100 μM DHFR with varying NADP+ concentrations, and (C) 100 μM DHFR and 1000 μM NADP+ with varying folate concentrations. The black lines indicate the lines of best fit for each transient when fit to a double-exponential curve.
