
Figure 5.
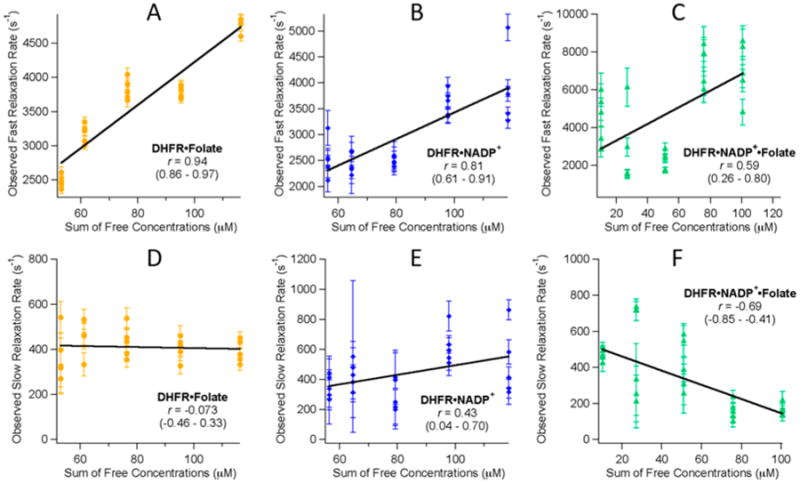
Correlation plots detailing the linear correlation of the observed temperature-jump relaxation rates vs the sum of the free concentrations of enzyme and ligand. Plots A–C show the correlation of the observed faster relaxation rate. Plots D–F show the correlation of the observed slower relaxation rates. The linear correlation coefficient, r, is given in each plot along with the 95% confidence interval for each correlation coefficient given in parentheses.