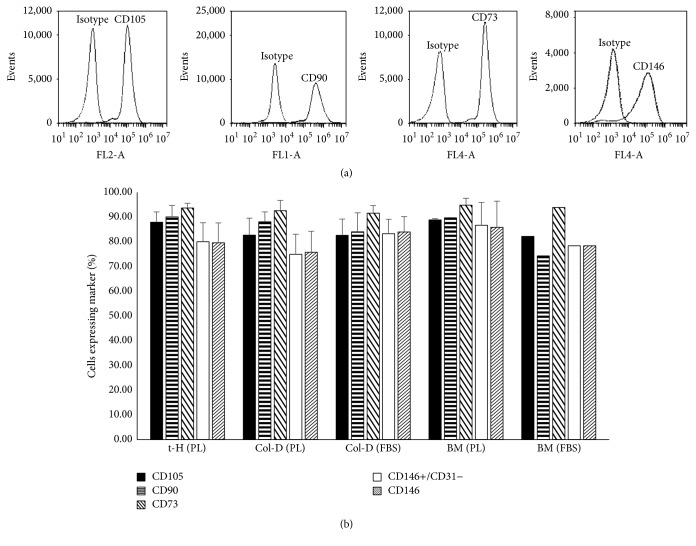
Figure 5.
Umbilical cord MSCs express characteristic mesenchymal cell surface markers by flow cytometry. (a) Representative histograms from passage 3 demonstrate expression of mesenchymal markers (CD90, CD105, CD73, and CD146) in cultured UC-MSCs. Histograms show antibodies with their respective isotype controls. (b) Bar graph demonstrates the mean expression of different mesenchymal markers by cultured MSCs derived from umbilical cord (n = 8). CD45, CD34, CD14, CD20, and CD31 are not shown since expression levels were less than 2%. Bone marrow MSCs were used as controls for cell marker expression. Each bar represents mean ± SD.

