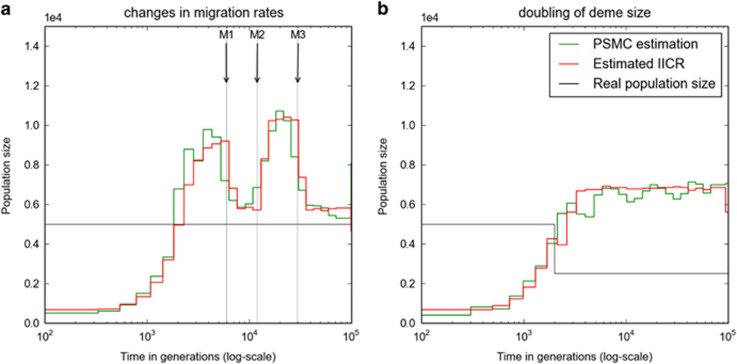
Figure 5.
Inferred population size changes under population structure with changes in migration rates or deme size. The x axis represents time in generations, whereas the y axis represents real or inferred population size in units of 104 diploid genomes. Color codes are identical to Figure 4. Data were simulated under an n-island model with n=10. In (a) the population size was constant in size with each deme having a size N=1000 haploid genomes (500 diploids) but three changes in migration rate occured at T3=30 000, T2=12 000 and T1=6000 generations in the past. Before T3 the migration rate was M3=5. At T3 it changed to M2=0.8 and remained constant until T2, and then changed to M1=5 at T1. After that it remained at M=1 until the present. In (b) all the demes doubled in size from 500 to 1000 haploids (or 250 to 500 diploids) at T=2000 generations and migration was constant with M=1. A full color version of this figure is available at the Heredity journal online.

