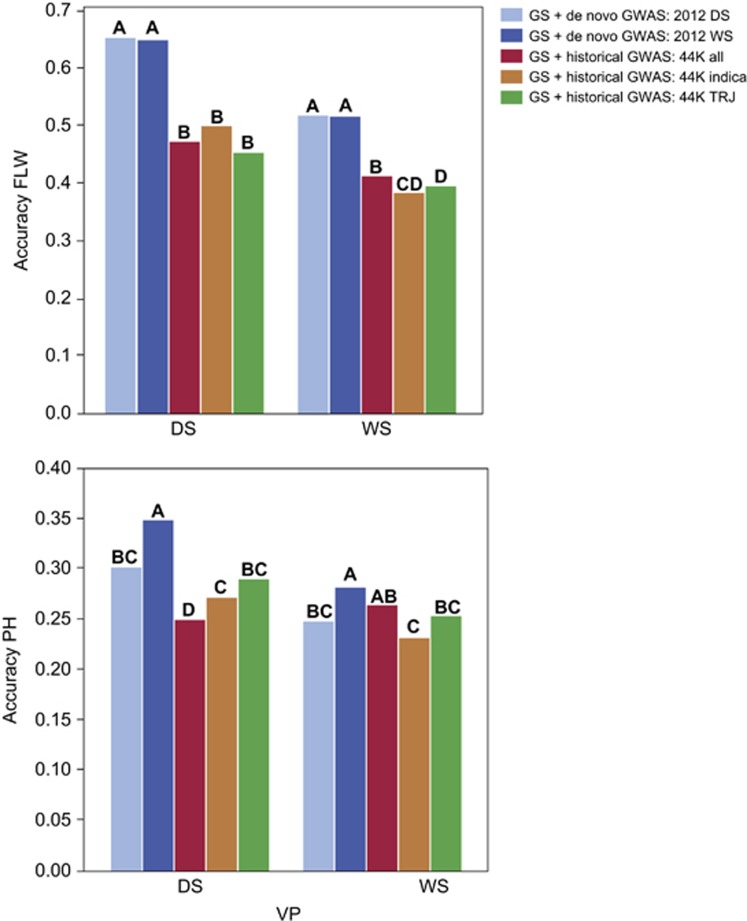
Figure 2.
Comparison of GS + de novo GWAS with GS + historical GWAS models for flowering time (FLW, top), and plant height (PH, bottom). Graphs shows the results using the optimized training population for prediction of each trait in the RYT 2012 dry season (DS) and RYT 2012 wet seasons (WS; that is, the cross-validation experiment that resulted in the best prediction accuracy for each trait in each validation season; see Supplementary Table S2A). GS + GWAS models differed in the GWAS data used to select the SNPs fit as fixed effects. GS + de novo GWAS: 2012 DS (light blue)=de novo GWAS using 2012 DS data on training population individuals, GS + de novo GWAS: 2012 WS (dark blue) =de novo GWAS run using 2012 WS data on training population individuals, GS + historical GWAS: 44K all (red)=previously published (historical) GWAS data were used from Zhao et al., 2011 the 'all subpopulations' results, GS + historical GWAS: 44K indica (burnt orange)= the indica subpopulation results from Zhao et al. 2011 were used, GS + historical GWAS: 44K TRJ (green)=the tropical japonica results from Zhao et al. (2011) were used. Bars not labeled with the same letter indicate a significant difference in model accuracies across all experiments.

