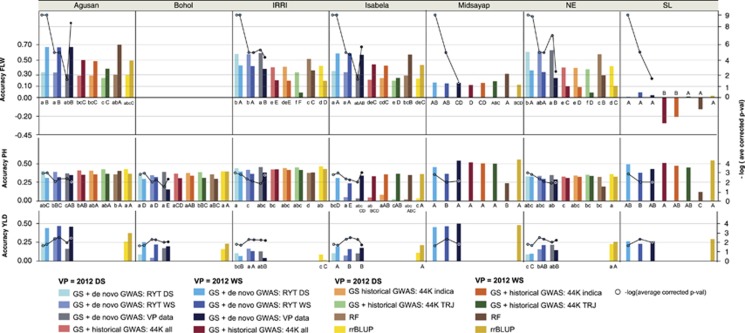
Figure 5.
Cross-validation prediction accuracies of flowering time (FLW, top), plant height (PH, middle), and grain yield (YLD, bottom) using multi-environment (MET) data. Data show the best overall MET accuracies obtained for each trait in each validation season, the 2012 dry season (DS; light shades) and the 2012 wet season (WS; dark shades), and validation site, left axis (Supplementary Table S4A). Accuracies are compared for GS + de novo GWAS models using, as GWAS input, the RYT 2012 DS GWAS results (blue bars), the RYT 2012 WS GWAS results (purple bars), and GWAS run using the validation site and season (gray/black bars) to RR-BLUP results (yellow bars), and for FLW and PH only, the GS + historical GWAS results (red, orange, and green bars for 44K all, 44K indica, and 44K tropical japonica results, respectively), and random forest (RF) results (brown bars). Bars not labeled with the same lower case letter indicate a significant difference in the performance of statistical methods across all experiments where the validation population=2012 DS, bars not labeled with the same capital letter indicate a significant difference in the performance of statistical methods across all experiments where the validation population=2012 WS. Circles mapped to right axis=−log * average P-value (Wald test) of the SNPs fit as fixed effects in the GS + de novo GWAS models, after FDR multiple-test correction.

