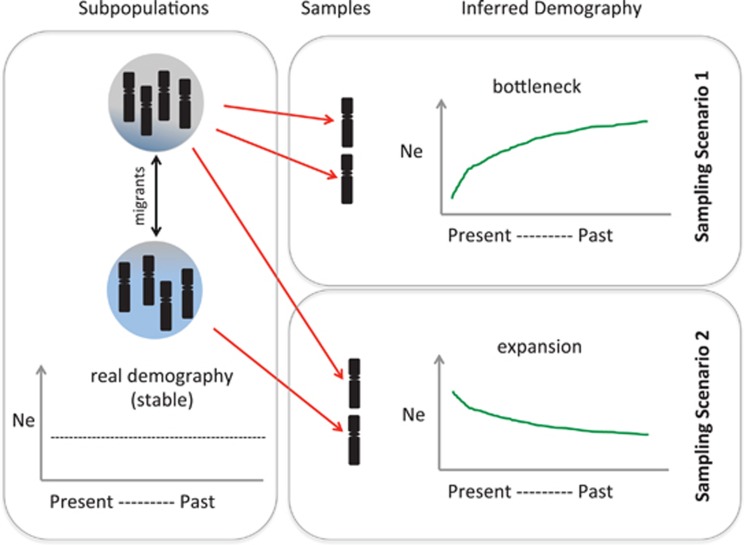
Figure 1.
Schematic diagram of a structured population and the inferred demographic histories from two alternative sampling scenarios. Two subpopulations are shown (one grey and one blue) which exchange migrants at varying rates throughout time, and which have a stable demographic history. In scenario 1, a diploid individual is sampled whose haplotypes derive from the same subpopulation and a bottleneck type demographic trend was inferred; while in scenario 2, an individual is sampled whose haplotypes derive from different subpopulations (e.g. the F1 from a migrant) and an expansion type demographic trend was inferred.

