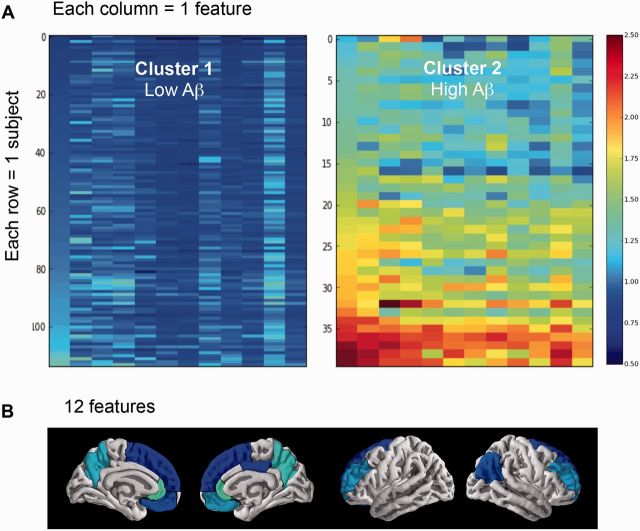
Figure 2.
Cluster analysis. Cluster analysis containing two clusters (groups) representing individuals with low and high amyloid burden (A), as well as the 12 features (brain regions) that helped identify these two clusters (B). Cluster 1 (left) represents subjects with low amyloid-β (Aβ) values while Cluster 2 (right) represents subjects with high amyloid-β values. Warmer colours are associated with higher DVR values (see the DVR colour scale ranging from 0.5 to 2.5). For each cluster, each row represents one subject and each column represents one of the 12 features that helped identify the two clusters. From left to right, the 12 features are: rostral anterior cingulate left hemisphere (lh); rostral anterior cingulate right hemisphere (rh); precuneus rh; precuneus lh; medial orbitofrontal rh; rostral middle frontal lh; rostral middle frontal rh; inferior parietal rh; medial orbitofrontal lh; superior orbitofrontal rh; posterior cingulate rh; and superior orbitofrontal lh. These 12 features are also projected on a brain with the lighter colours corresponding to the features that have the highest weight in the model (see Supplementary Table 2 for the weight of each feature in the model).

