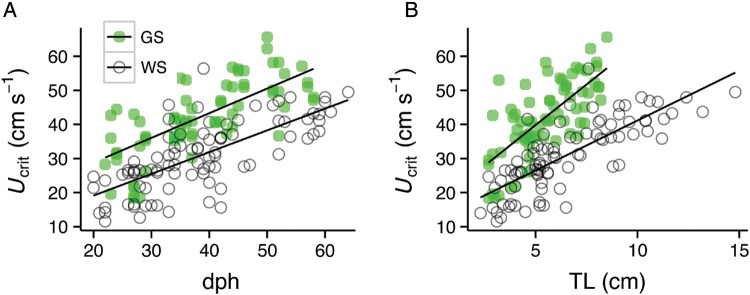
Figure 2.
Ontogeny of larval green and white sturgeon critical swimming velocity (Ucrit, in centimetres per second) vs. days post-hatch (A) and total length (B) through the larval life stage. The equations of the regressions for Ucrit (in centimetres per second) vs. days post-hatch were y = 14.34 + 0.724x with an r2 of 0.469 and y = 6.36 + 0.638x with an r2 of 0.497 for larval green (n = 72) and white sturgeon (n = 87), respectively. The equations of the regressions for Ucrit (in centimetres per second) vs. days post-hatch were y = 15.97 + 4.766x with an r2 of 0.508 and y = 11.84 + 2.930x with an r2 of 0.603 for larval green (n = 72) and white sturgeon (n = 87), respectively.

