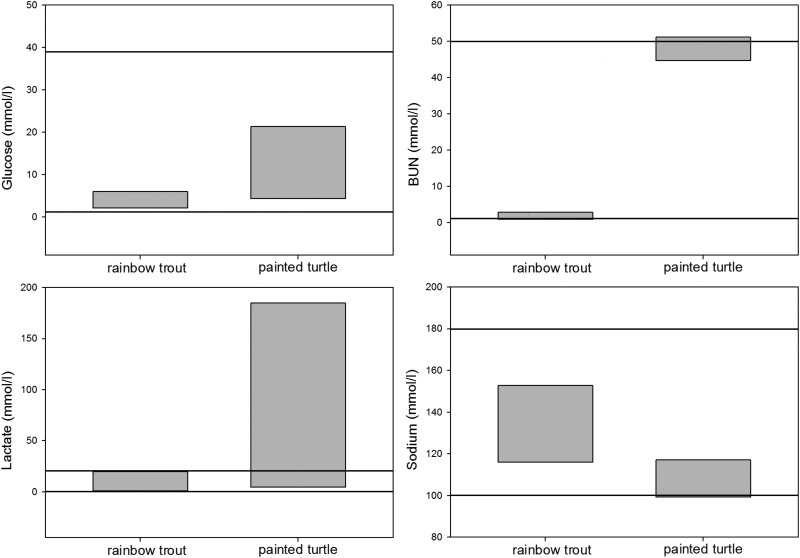
Figure 1:
Whole blood values for select analytes on representative commonly studied species, the rainbow trout (Oncorhynchus mykiss) and the painted turtle (Chrysemys picta). Box plots represent the maximal ranges from the literature and horizontal lines represent the maximal reportable range of the most commonly used point-of-care device in the present study, the i-STAT analyser.

