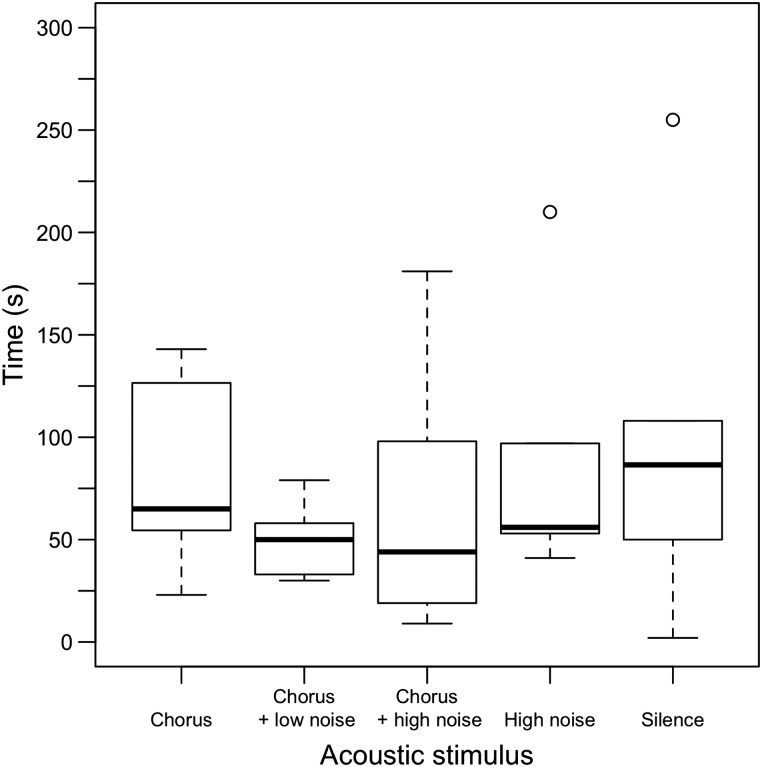
Figure 4:
Acoustic stimulus had no effect on time to leave the arena for the subset of individuals that left. Sample sizes for chorus, chorus + low noise, chorus + high noise, high noise and silence are n = 11, 10, 9, 5 and 6, respectively. Boxes represent interquartile ranges, horizontal lines represent medians, and vertical dashed lines represent adjacent values not greater than 1.5 times the height of the box.

