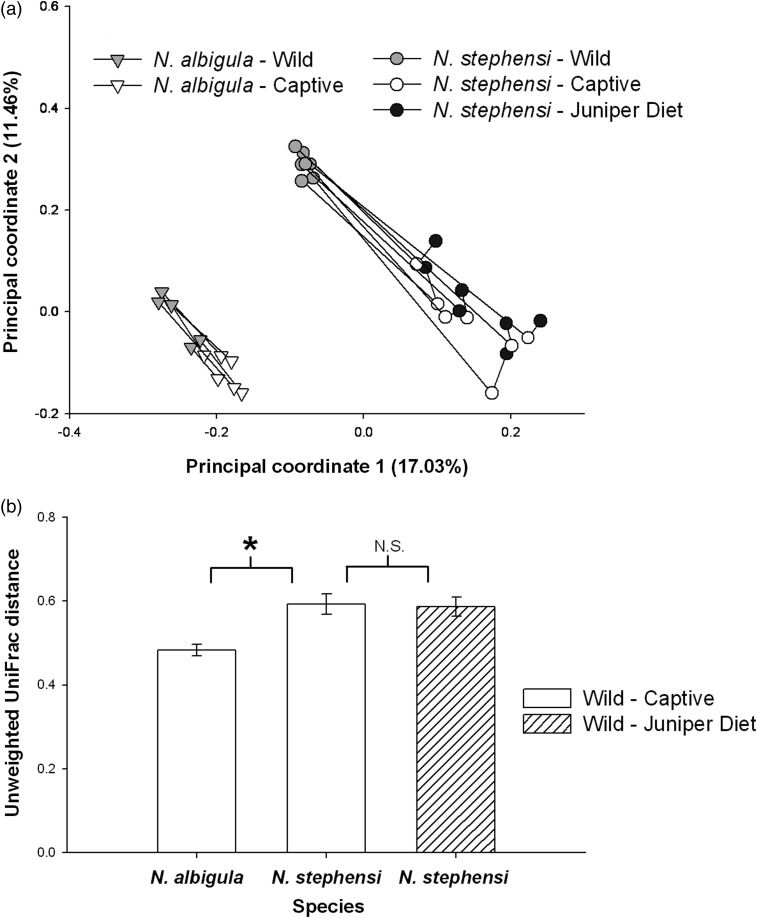
Figure 3:
Changes in microbial communities between the wild and captivity. (a) Principal coordinates analysis. Lines connect an individual over time. (b) Unweighted UniFrac distances. Open bars represent mean distances between samples from the wild compared with animals in captivity. The hatched bar represents the distance between samples collected from animals in the wild to samples collected from animals fed the juniper diet. The asterisk denotes statistical significance between N. albigula and N. stephensi. The difference between N. stephensi fed commercial chow and 75% juniper was not significant (n.s.).

