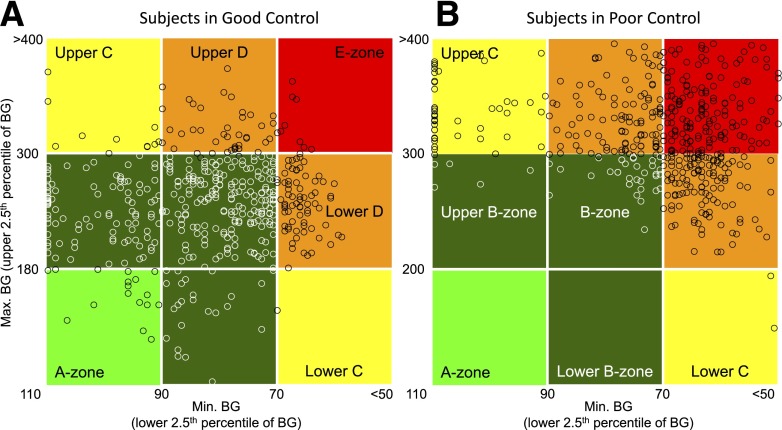
Figure 3.
VGA. A split of a population of 335 below the median ADRR (A) and above the median ADRR (B) illustrated by the VGA. Each data point has BG coordinates (minimum, maximum) for a subject during the observation period. Subjects in A are in good control with most of the data points (70.4%) in the A- and B-zones; subjects in B are in poor control with most of the data points (89.6%) in the C-, D-, and E-zones.

