
Table 2.
Metrics of the timing of GV
| Metric | Formula | Meaning |
|---|---|---|
| SD of the BG rate of change |
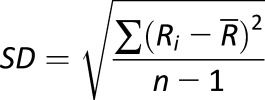 , where , where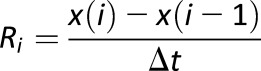 is the BG rate of change at time (i) and is the BG rate of change at time (i) and  is the average BG rate of change is the average BG rate of change |
Variation of the speed of BG fluctuation; particularly applicable to BG readings that are equally spaced in time, such as CGM data |
| MODD |
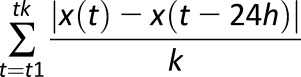 , where k is the number of available data pairs 24-h apart , where k is the number of available data pairs 24-h apart |
Intraday GV computed from all 24-h time intervals where paired readings are available at the beginning and at the end of 24 h |
| CONGA |
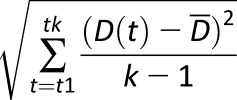 , where D(t) is the difference between BG at time t and BG taken n hours earlier, and , where D(t) is the difference between BG at time t and BG taken n hours earlier, and  is the average of these differences is the average of these differences |
MAGE exceeding the SD of GV |
In all formulas, x = BG level.