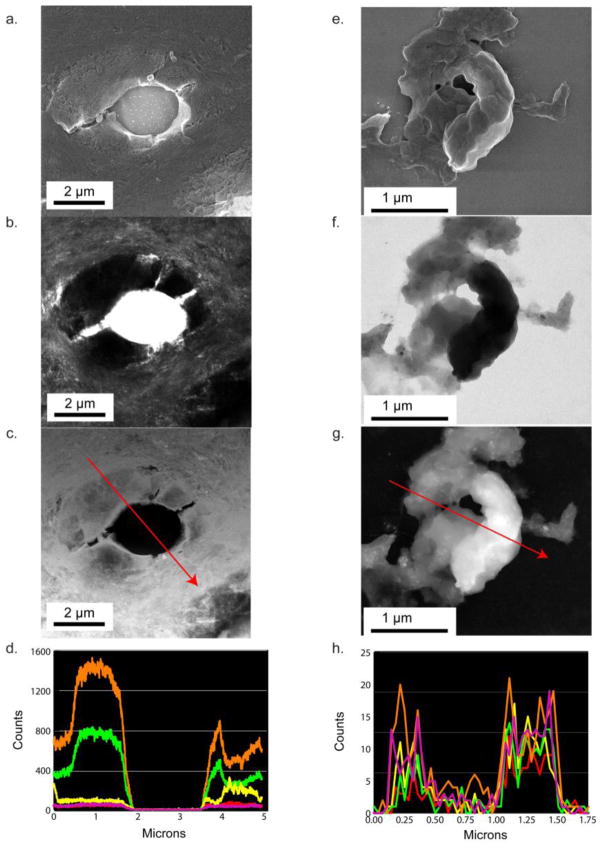
Figure 2.
Analysis of individual tubule contents in intact and laser capture ablated sections of dentin. a,b,c,d. An intact region of tubule PTD with surrounding ITD examined with Scanning EM a., Transmission EM b., ZC c. and a dual EDS linescan d. showing the relative signal counts of calcium (orange), phosphorous (green), sodium (red), chlorine (yellow), and sulfur (fuscia). e, f, g, h. An isolated tubule-PTD complex partially ablated by laser micro-dissection. No ITD is included. e., Sample examined with SEM f., TEM; g. Z contrast, ZC, and h. the dual EDS linescans showing the relative signal counts of calcium (orange), phosphorous (green), sodium (red), chlorine (yellow), and sulfur (fuscia).

