Figure 4.

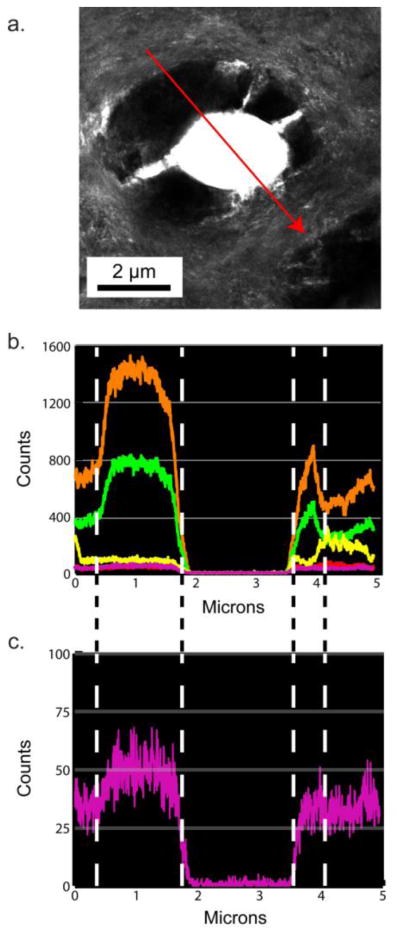
An intact region of tubule, PTD and ITD (a.), with an EDS linescan calcium (orange), phosphorous (green), sodium (red), chlorine (yellow), and sulfur (fuscia) (b.) and a magnified plot of just the signal from sulfur (c.).

An intact region of tubule, PTD and ITD (a.), with an EDS linescan calcium (orange), phosphorous (green), sodium (red), chlorine (yellow), and sulfur (fuscia) (b.) and a magnified plot of just the signal from sulfur (c.).