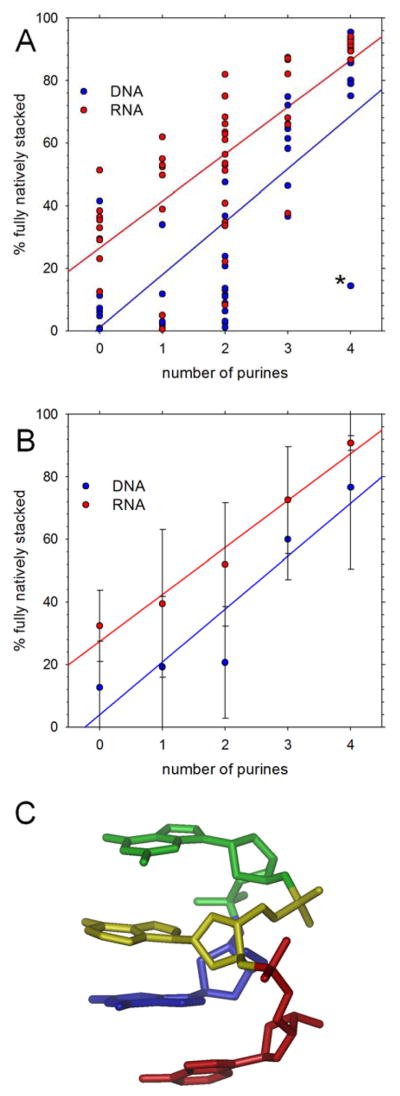
Figure 1. Native stacking in simulations starting from natively stacked conformations.
A. Percent of conformations that are fully natively stacked in production simulations; each symbol represents a different tetranucleotide; the asterisk marks the anomalously behaving d(GGAA) tetranucleotide. B. Same as A but with results grouped and averaged by the number of purines in the sequence. C. Snapshot showing the stable, non-native stacking arrangement adopted by d(GGAA); residues are colored using rainbow ordering: G1(blue), G2 (green), A3 (yellow), A4 (red).

