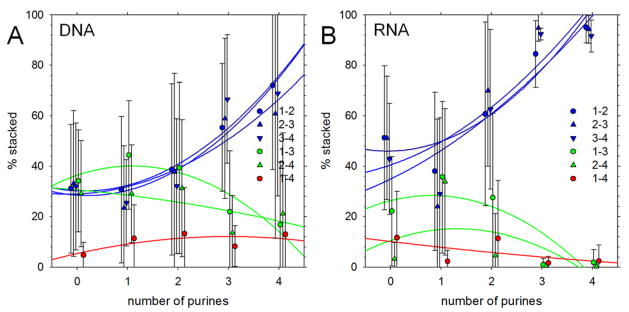
Figure 5. Populations of base-stacking interactions in simulations starting from initially unstacked conformations.
A. Percent of conformations that contain stacking interactions of various types plotted versus number of purines in the DNA sequence. Results shown are averages obtained by grouping sequences by the number of purines they contain; error bars represent standard deviations. Blue symbols represent ‘native’ stacking interactions, i.e. base stacks that involve residues adjacent in the sequence. Lines represent quadratic regression lines. B. Same as A but showing results for RNA tetranucleotides.

