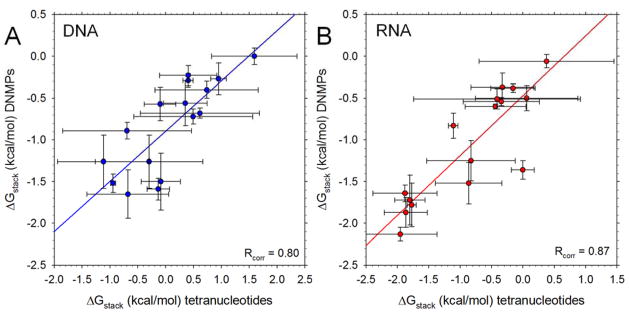
Figure 6. Comparison of computed free energies of stacking, ΔGstack, in tetranucleotides and dinucleoside monophosphates (DNMPs).
A. Plot of computed ΔGstack values in DNA DNMPs versus the corresponding ΔGstack values computed here fosr the central bases (i.e. the 2–3 stacking inteaction) of DNA tetranucleotides. Each datapoint represents a different sequence (AA, AC etc); error bars represent standard deviations calculated for all simulations of all tetranucleotides possessing the same 2–3 sequence. Line shows linear regression y = mx + b with m = 0.60 (p-value = 0.0002) and b = −0.89 (p-value < 0.0001). Data for the DNMPs are taken from ref. 25. B. Same as A but showing results for RNAs. Parameters for the linear regression are m = 0.58 (p-value = 0.0008) and b = −0.74 (p-value = 0.0001).

