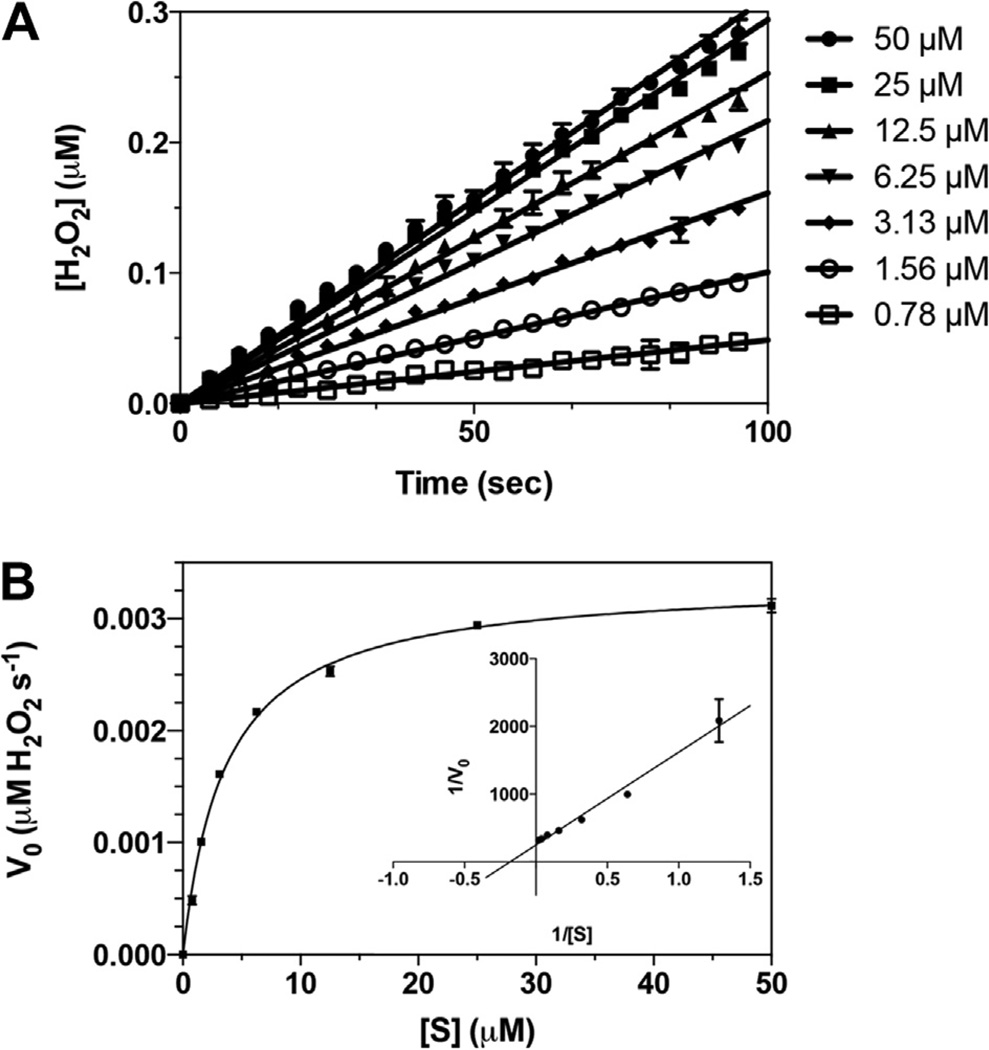
Fig. 4.
chKDM1AΔTower is an active enzyme. (A) Representative linear fit of initial rates from substrate titration against chKDM1AΔTower. Plots are within 10% product conversion. Concentrations indicated are that of the H3K4me21–21 peptide substrate. (B) Representative initial velocity curve of the catalytic activity of chKDM1AΔTower. Data are fit to the Henri–Michaelis–Menten equation. Inset is a reciprocal plot, 1/V0 (s µM−1 H2O2) vs. 1/[S] (µM−1), to illustrate linear nature of data.

