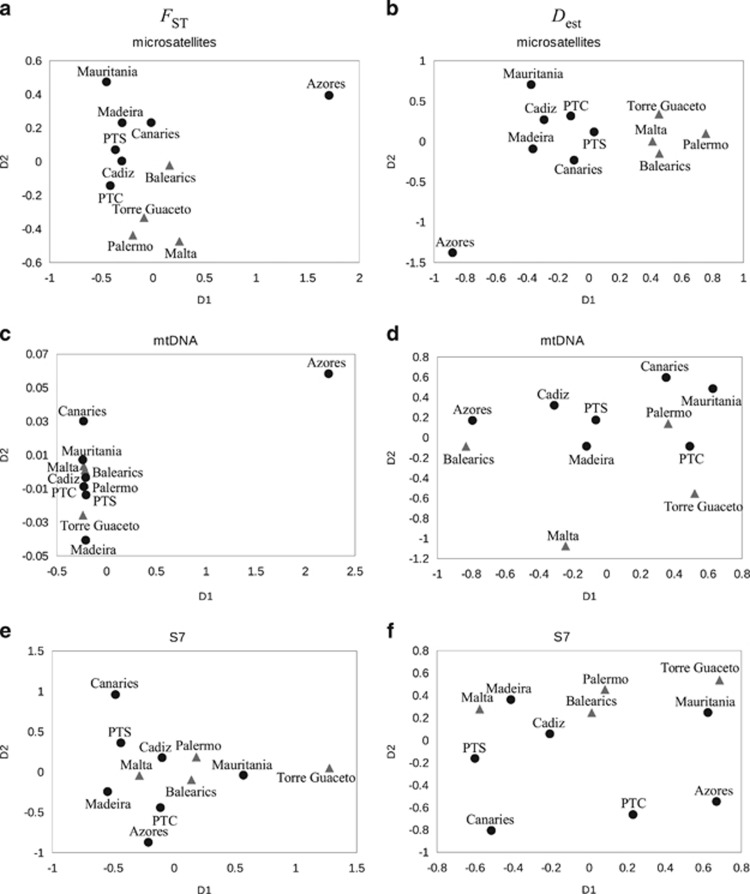
Figure 4.
Multidimensional scaling plot based on the matrix of FST pairwise comparisons from microsatellites (a and b), mtDNA CR (c and d) and S7 (e and f) data sets, respectively. PTC, Portugal Centre (Sesimbra, Tejo and Sado estuary); PTS, Portugal South (Algarve, Arade and Lagos). Dark grey dot refers to Atlantic and light grey triangles refer to Mediterranean samples.

