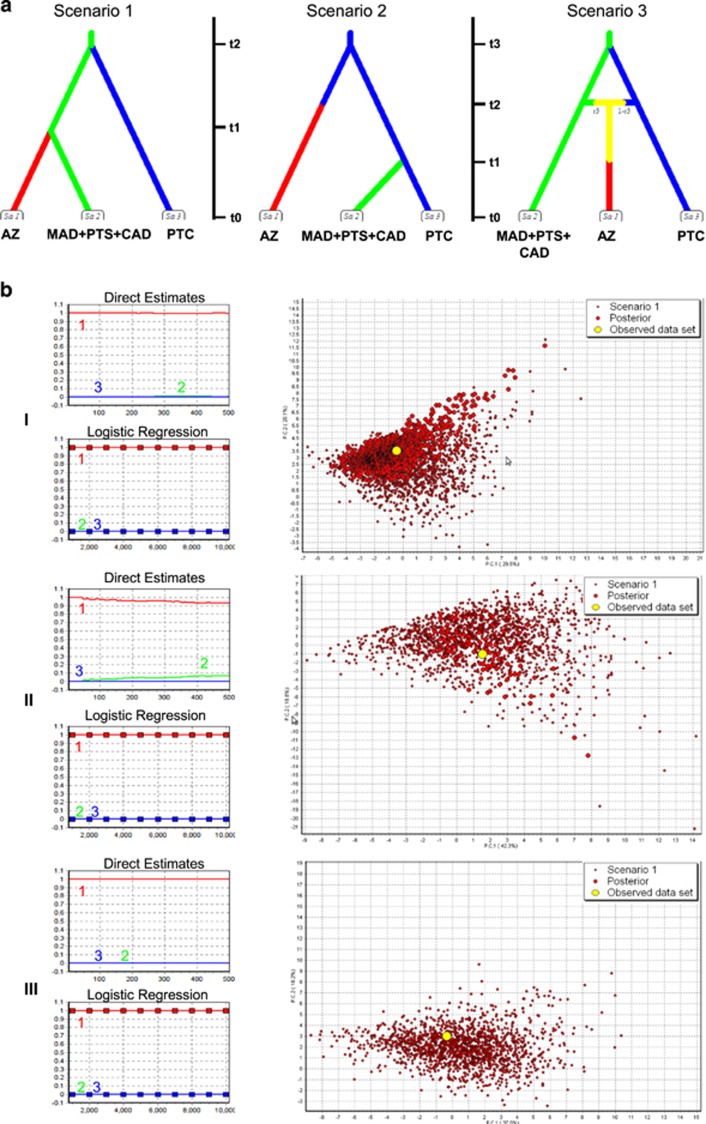
Figure 6.
(a) The three most realistic ABC scenarios comparing the Azorean sample (AZ) with two other potential source populations. (b, left) Reliability of all scenarios under the three models (I=Cornuet–Miller; II=Beaumont; III=Guillemaud) visualised through posterior probabilities as the relative proportions (direct estimates) and logistic regressions (red, green and blue represent the parameters associated to the scenarios 1, 2 and 3, respectively). (b, right) Principal component analysis (PCA) showing the good fit of posterior distributions for scenario 1 under the three models (the observed data—large yellow spots—fall in the clouds of the dots representing the posterior (larger red dots) and the prior (smaller red dots) distributions). CAD, Cadiz; MAD, Madeira Is.; PTC, Portugal Centre (Sesimbra, Tejo and Sado estuary); PTS, Portugal South (Algarve, Arade and Lagos).

