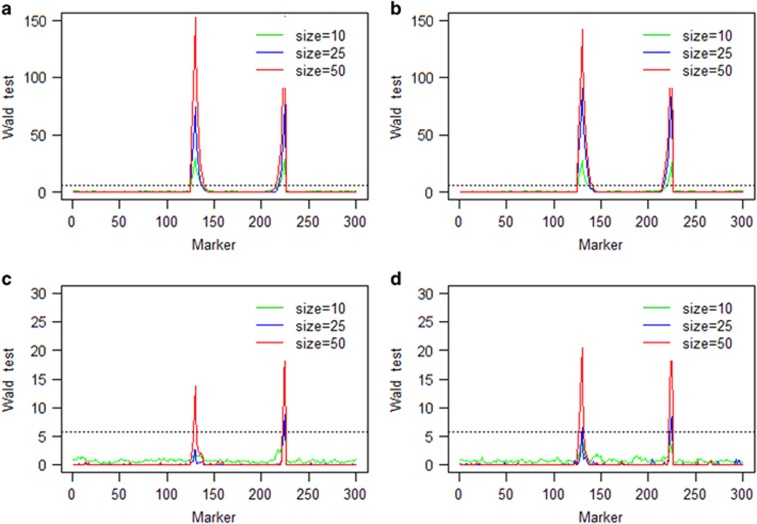
Figure 4.
Wald test statistics of the two-locus selection simulation experiment using two combined populations: (a) strong additive fitness selection; (b) strong dominance fitness selection; (c) weak additive fitness selection; and (d) weak dominance fitness selection. The horizontal broken line on each panel is the 5.83 threshold in Wald test statistics drawn from 1000 repeated simulations under the null model.

