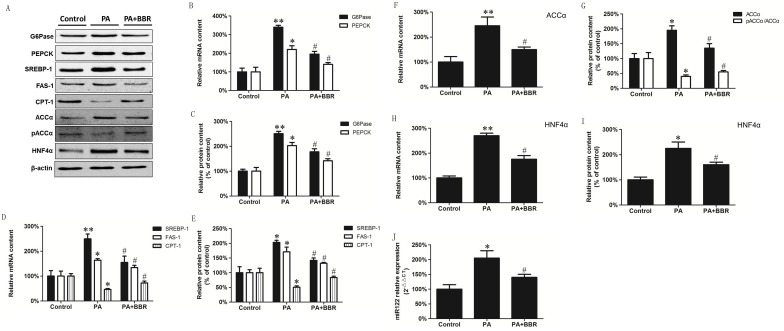
Fig 4. BBR treatment attenuates the alteration in gluconeogenesis and lipid metabolism and expression of HNF-4α and miR122 in PA-treated HepG2 cells.
HepG2 cells were incubated in the absence or presence of 0.3 mM PA or 0.3 mM PA with 10 μM BBR for 24 h and expression of G6Pase, PEPCK, SREBP-1, FAS-1, CPT-1, ACCα, pACCα, HNF-4α, β-actin and miR122 were determined as described in Materials and Methods. A. A representative blot showing G6Pase, PEPCK, SREBP-1, FAS-1, CPT-1, ACCα, pACCα, HNF-4α and β-actin. B. mRNA expression of G6Pase and PEPCK. C. Relative protein expression of G6Pase and PEPCK. D. mRNA expression of SREBP-1, FAS-1 and CPT-1. E. Relative protein expression of SREBP-1, FAS-1 and CPT-1. F. Relative protein expression of ACCα and ACCα/pACCα. G. mRNA expression of ACCα. H. mRNA expression of HNF-4α. I. Protein expression of HNF-4α. J. miR-122 expression in HepG2 cells. Data represent the mean ± SEM (n = 12). *p<0.05, **p<0.01 vs Control; #p<0.05 vs PA-treated HepG2 cells.

