
Figure 3.
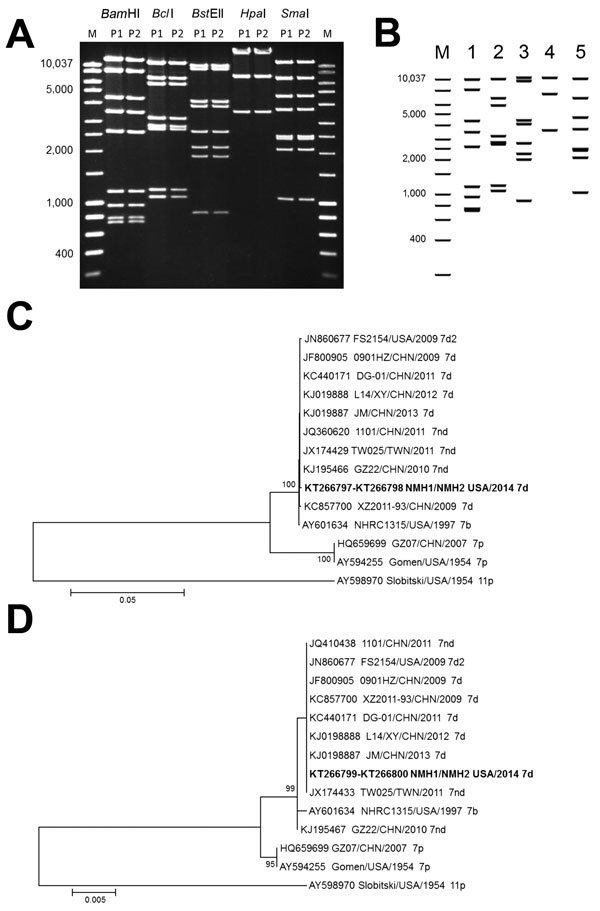
Enzyme and phylogenetic analysis of human adenovirus 7 isolates from 2 patients in Illinois, USA, 2014, and comparison isolates. A) Restriction enzyme analysis of genomic DNA from human adenovirus 7 isolates from patients 1 and 2 (P1 and P2, father and son). Lane M, molecular mass marker. Values on the left are in basepairs. B) Virtual restriction enzyme analysis of 6 complete genomic sequence of adenovirus strain DG01 from China. Lane m, Molecular mass marker; lane 1, BamHI; lane 2, BclI; lane 3, BstEII; lane 4, HpaI; lane 5, SmaI. Values on the left are in basepairs. Phylogenetic analysis of C) hexon (HVR1–7) and D) fiber genes of adenovirus 7 strains from Asia and North America. Strains isolated in this study are indicated in bold. Phylogenetic trees were inferred by using the neighbor-joining method with 1,000 replicates. Bootstrap values are shown at branching points, and values <70% are not shown. Evolutionary distances were computed by using the Kimura 2-parameter method. There were 14 nt sequences and 1,509 positions in the final dataset for hexon gene analysis and 978 positions for fiber gene analysis. Analyses were conducted in MEGA6 (10). Hexon and fiber genes of human adenovirus 11p (strain Slobitski) were used as references. Scale bars indicate nucleotide substitutions per site.