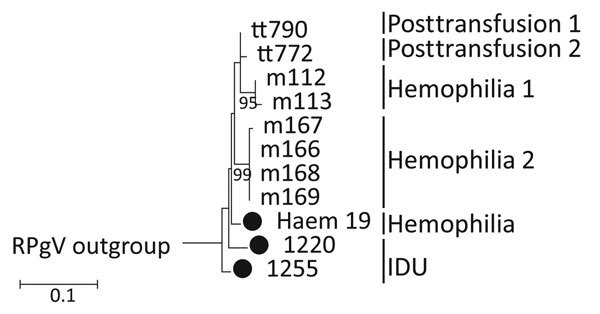
Figure 2.

Maximum-likelihood (ML) phylogenetic analysis of human pegivirus sequences. NS3 region sequences (positions 4609–4880 as numbered in the AK-790 reference sequence, denoted here as tt790) were selected to overlap with sequences from PCR-derived amplicons generated in this study (black circles) and partial NS3 region sequences reported previously (6). The tree was constructed by using the maximum likelihood algorithm implemented in the MEGA6 software package (16). The optimum ML model (lowest Bayesian information criterion score and typically greatest ML value) was Kimura 2 parameter and invariant sites. Phylogenetic analysis of each dataset used 100 bootstrap re-samplings to infer the robustness of groupings. The tree was rooted with a rat pegivirus sequence (GenBank accession no. KC815311, not shown). IDU, injection drug use; NS, nonstructural. Scale bar indicates nucleotide substitutions per site.
