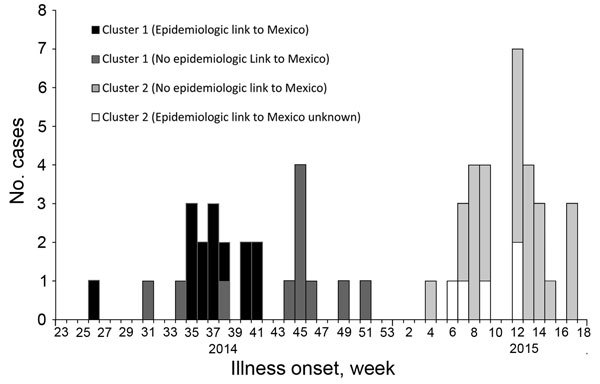
Figure 1.

Epidemic curve of Shiga toxin 1–producing Shigella sonnei cases in California (N = 56), by week of illness onset, cluster, and epidemiologic link to Mexico, June 2014–April 2015. Cluster 1, southern California, June–December 2014 (n = 25); cluster 2, San Joaquin County, northern California, January–April 2015 (n = 31). Illness onset week designated using Centers for Disease Control and Prevention Morbidity and Mortality Weekly Report weeks.
