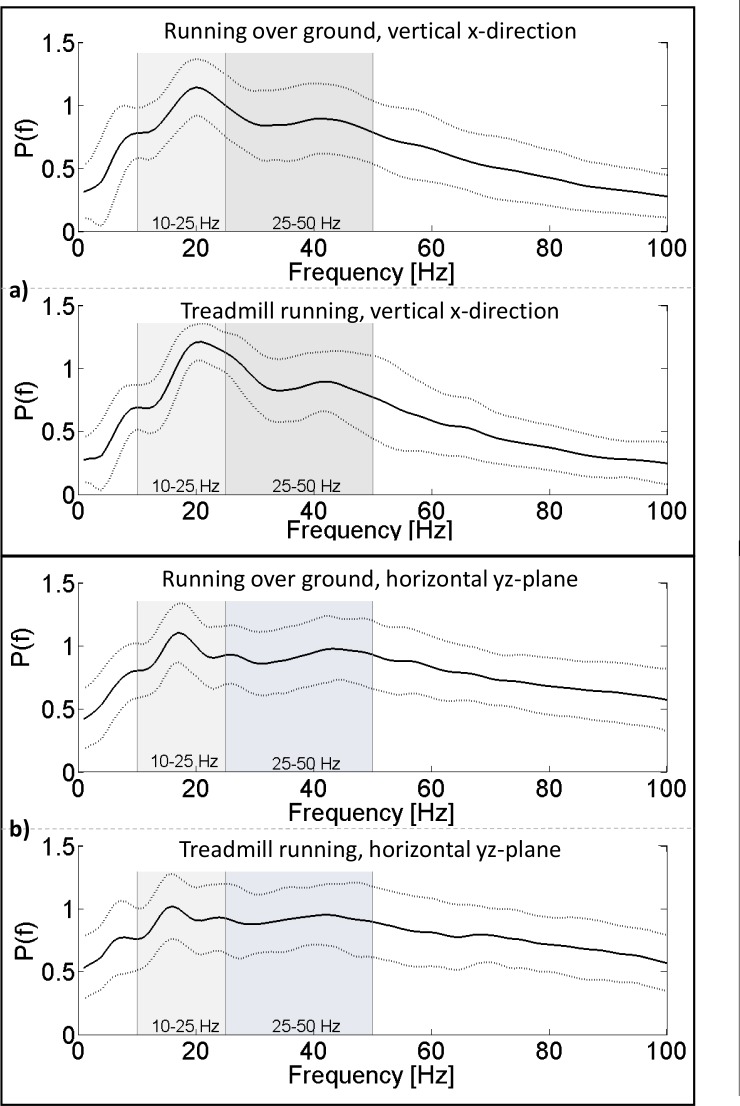
Fig 5. Normalized power spectrum of the distal accelerometer.
Average power spectrum for running over ground and running on a treadmill, separated in two measurement directions. Graph a) shows data in the vertical x-direction while graph b) shows data in the horizontal yz-plane. Solid lines indicate mean values of all study participants, dashed lines indicate SDs. Low-frequency and medium-frequency intervals are depicted in the graphs.

