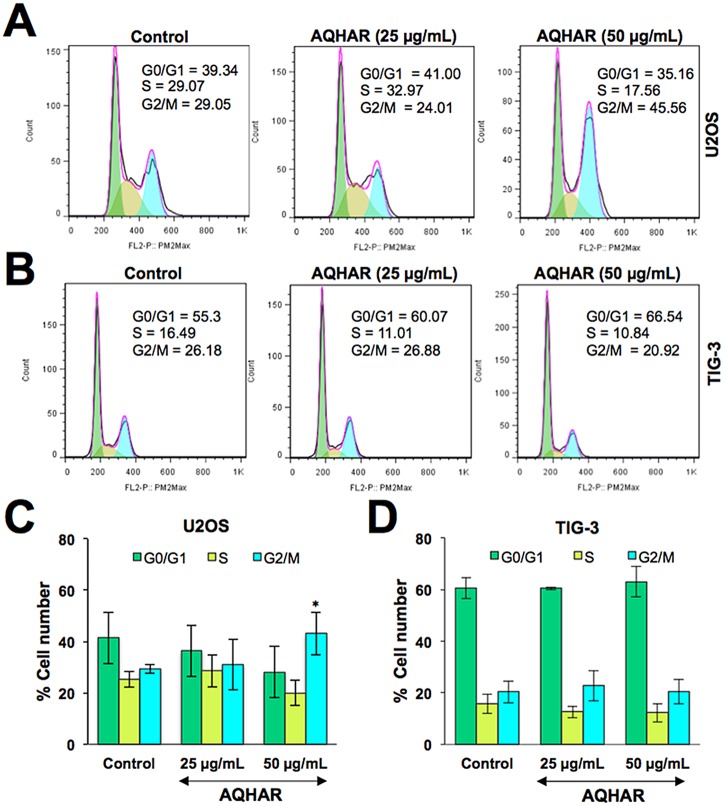
Fig 2. Cell cycle analysis of control and AQHAR treated cancer and normal human cells.
Cell cycle distribution of control and AQHAR-treated U2OS (A and C) and TIG-3 (B and D) cells are shown. Results from three independent experiments are represented as mean ± SD. *p<0.05 denotes statistically significance difference between the control and treated groups.

