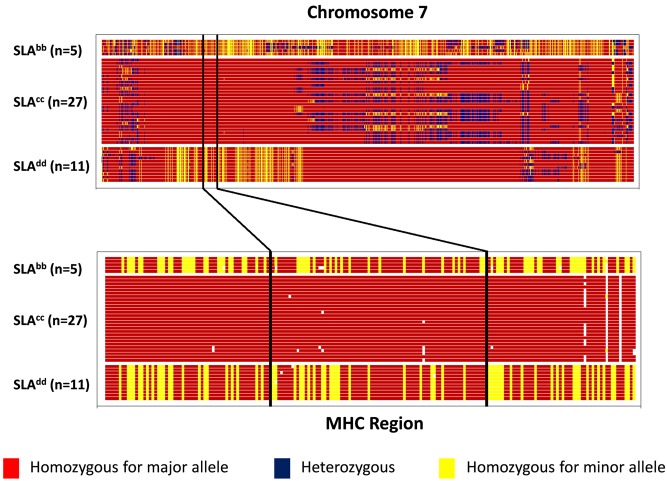
Fig 1. Genetic homozygosity map for chromosome 7 showing location of the MHC region in SLAbb, SLAcc and SLAdd line pigs.
Each horizontal line represents a genotyped pig. Pigs lines are grouped in blocks. Vertical lines depict SNPs, colour-coded according to genotype. White lines represent ungenotyped SNPs or null alleles. A ‘major’ allele is the more frequent allele and a ‘minor’ allele is the less frequent allele of a pair of alleles within a given line. Locations of SNPs within the chromosome run in ascending numerical order from left to right.

