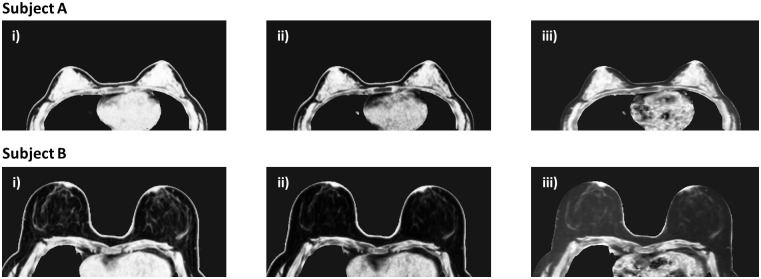
Fig 7. Low resolution water fraction images prior to signal correction for two subjects.
A) a 26 year old volunteer with 64.6% FGT and B) a 50 year old volunteer with 18.4% FGT. GRE PD, GRE T1 and SE T1-weighted images are shown in i), ii) and iii), respectively—the water fraction values within the fat are much higher in the SE T1-weighted datasets.

