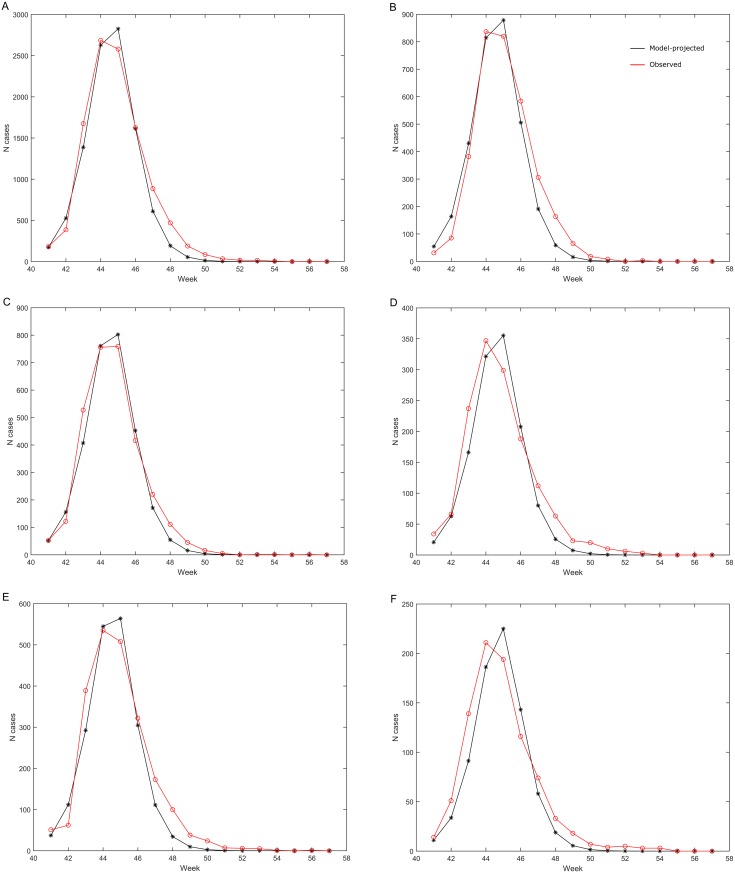
Fig 3. Number of symptomatic A/H1N1 2009 pandemic influenza cases projected by the model compared with the observed number of laboratory-confirmed A/H1N1 2009 pandemic influenza cases.
(A) all ages; (B) age 0–<10 years; (C) age 10–<20 years; (D) age 20–<30 years; (E) age 30–<50 years (pooled); (F) age 50+ years. Black: Model-projected cases scaled down to account for age-specific under-reporting factors. Red: Observed laboratory-confirmed cases reported to the surveillance system. Week number refers to 2009, and the first four weeks of 2010 are designated as weeks 54–57.

