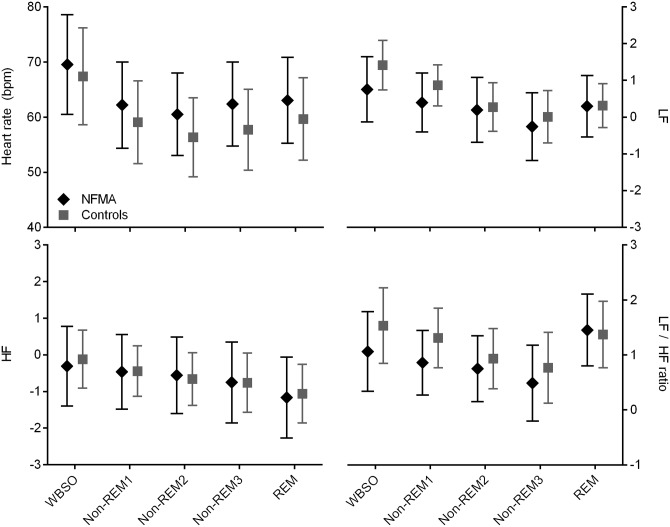
Fig 1. Heart rate variability in patients and controls.
Heart rate, low- and high frequency power and their ratio, in 15 NFMA patients and 15 healthy controls, stratified for wake and sleep stages. Data represent mean ± SD, calculated over averages for each subject. WBSO, wake before sleep onset; REM, rapid eye movement sleep; LF, low frequency power in ln(ms2/Hz); HF, high frequency power in ln(ms2/Hz). None of the differences reached statistical significance after correction for multiple testing (P < 0.01) in our secondary analysis.

