
Figure 1.
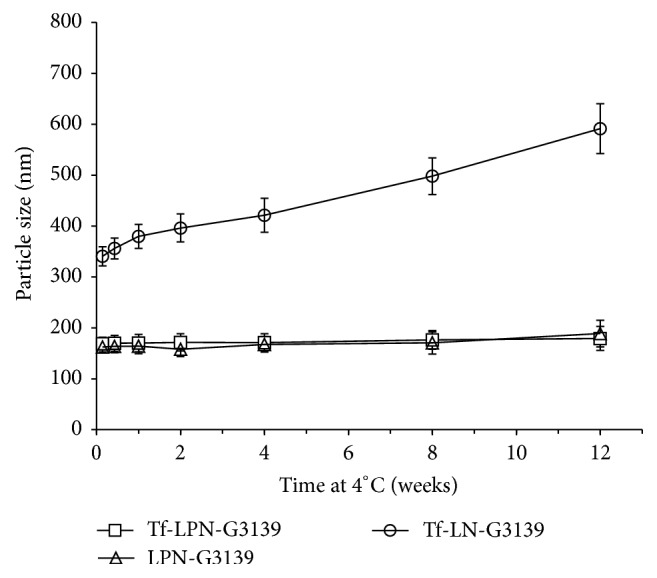
Colloidal stability over storage at 4°C. The values in the plot represent the mean particle sizes of 3 measurements. Error bars were standard deviations, n = 3.
Official websites use .gov
A
.gov website belongs to an official
government organization in the United States.
Secure .gov websites use HTTPS
A lock (
) or https:// means you've safely
connected to the .gov website. Share sensitive
information only on official, secure websites.
Colloidal stability over storage at 4°C. The values in the plot represent the mean particle sizes of 3 measurements. Error bars were standard deviations, n = 3.