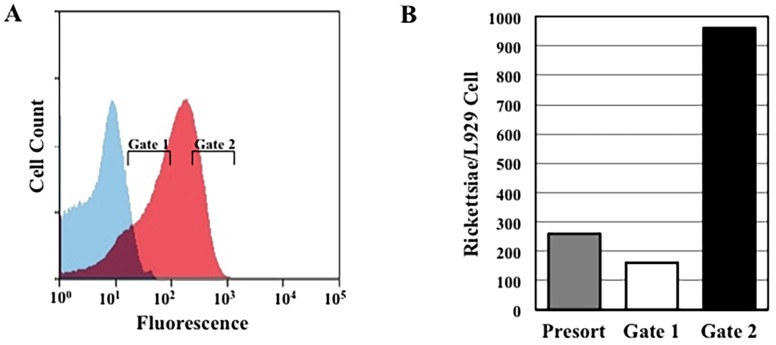
Fig 2. FACS analysis using RpCherry.
A) FACS analysis of L929 mouse fibroblasts infected with R. prowazekii expressing RpCherry. Fluorescence plots of uninfected (Blue) and infected (Red) cell populations are shown. Gates used for sorting lightly infected (Gate 1) and heavily infected (Gate 2) host cells are indicated. B) Data represents the ratio of the average number of genome equivalents of rickettsiae per L929 cells from three independent infections and five independent qPCR reactions for each condition.

