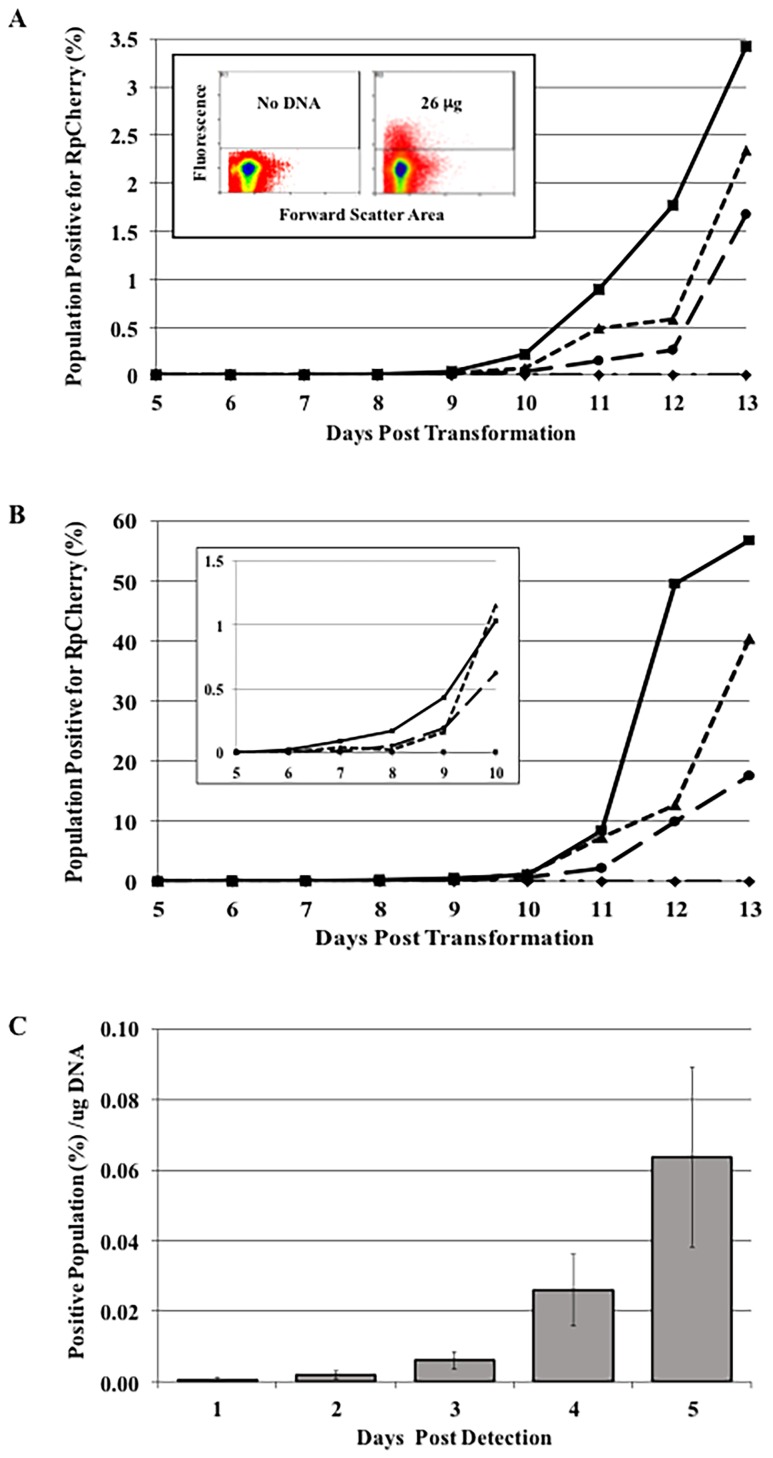
Fig 3. Appearance of pMW1710 transformants based on the concentration of transforming DNA.
Competent rickettsiae were electroporated in the presence of increasing amounts of pMW1710 DNA (♦ 0 μg, ● 6 μg, ▲13 μg, ■ 26 μg). Cells were analyzed on days 5–13 and the percent of RpCherry positive cells was determined. Two independent experiments (A and B) were performed. A) Experiment 1; Inset—Analysis was performed at 13 days following electroporation in the presence of 0 μg (Left) or 26 μg (Right) of pMW1710. B) Experiment 2; Inset—Area from days 5–10 on an expanded scale. C) RpCherry positive population per μg of DNA normalized to the first appearance of transformants. Bars represent the average of the two experiments with the range indicated.

