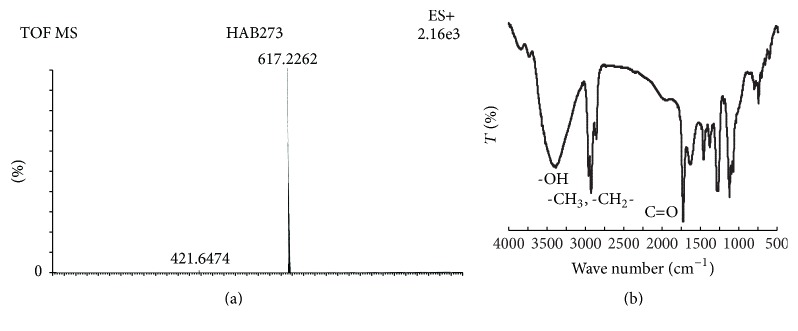
Figure 2.
(a) MS spectrum of the extracted haem from the native purified CAT. The sample was run in the ESI positive mode. Details of the experiment and results are discussed in the paper. (b) FTIR spectra of the isolated haem. Peaks corresponding to the representative functional groups of haem are shown in the figure.

