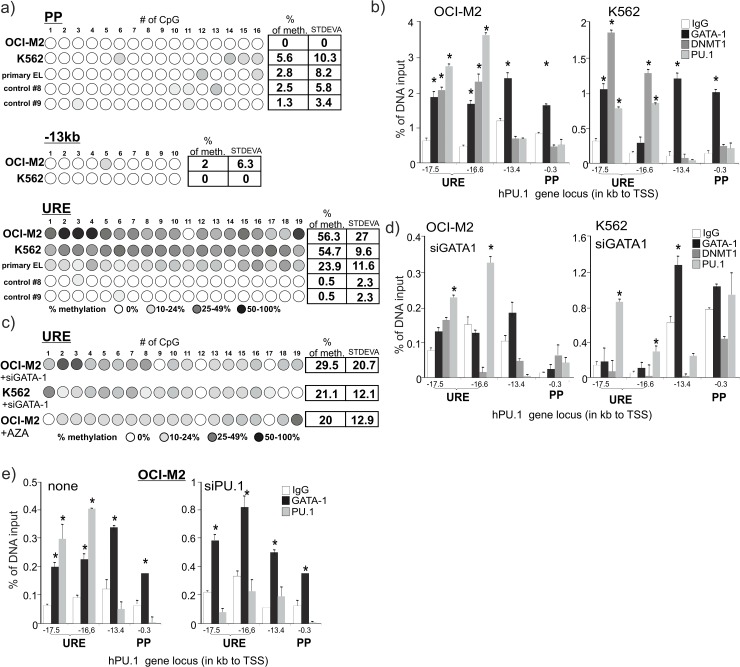
Fig 6. DNA methylation at PU.1 regulatory elements and DNMT1 occupancy in AML-ELs.
DNA methylation analysis at the PU.1 gene (a). Each circle corresponds to a CpG. Color shading indicates % methylation of PP, -13kb and URE in OCI-M2, K562, CD34+ cells isolated from bone marrow of AML-EL patient (primary EL) and normal bone marrow CD34+ (control #8 and #9). Tables show average DNA methylation in the indicated amplicons. (b) ChIP for GATA-1, DNMT1 and PU.1 occupancy at the PU.1 gene in AML-ELs. Amplicon positions are shown on the X-axis. Specific signals are expressed as % of DNA input. Nonspecific signals of IgG immunoprecipitates: gray columns. Two independent experiments were done in duplicates. Error bars: SE, *p≤0.05. (c) DNA methylation at the URE in OCI-M2 and K562 after GATA-1 siRNA treatment and of OCI-M2 cells following treatment with 5uM AZA (both for 48hrs). (d) ChIP for GATA-1, DNMT1 and PU.1 occupancy at the PU.1 gene 48hrs after GATA-1 siRNA or scrambled control oligo treatment in AML-ELs. (e) ChIP for GATA-1 and PU.1 occupancy at the PU.1 gene 48hrs after PU.1 siRNA or scrambled control oligo treatment in OCI-M2.

