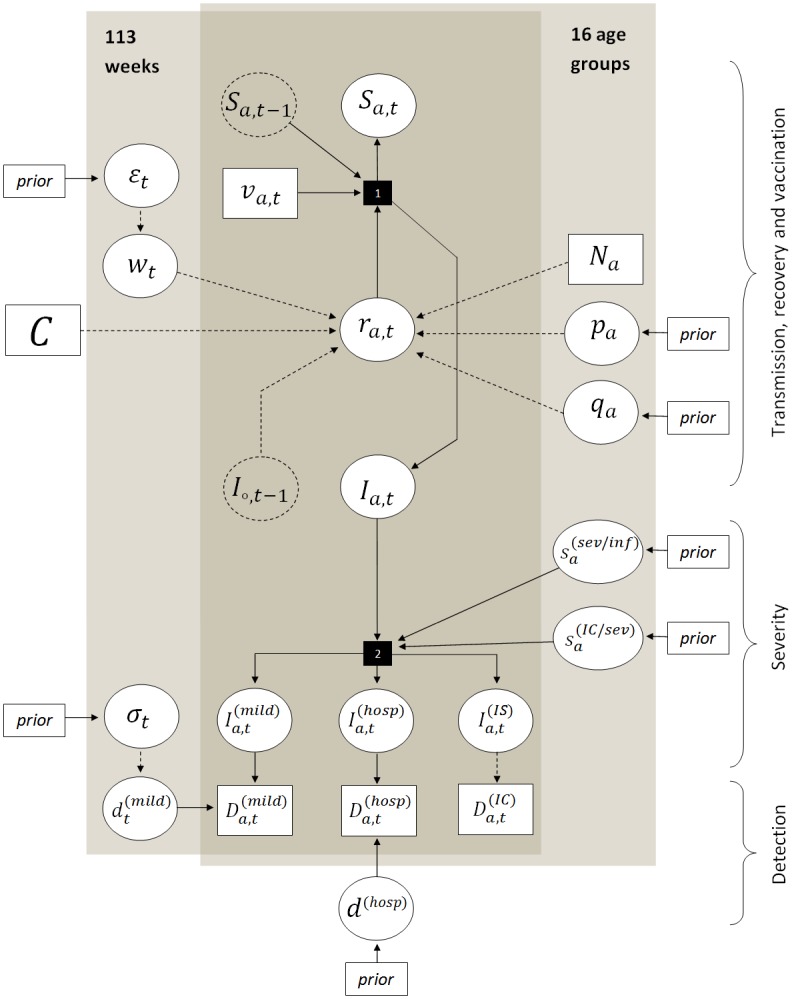
Fig 4. DAG of the model.

Circles represent model unknowns, rectangles known or fixed values. The plates highlight the values specified for each week and/or age group. Dotted circles are used to show the relations between strata. Smaller rectangles with “prior” sign point out those model parameters with specified prior distributions. Stochastic relations are indicated with solid lines, deterministic with dashed lines. Complex relations are shown as black rectangles: 1—infection process, 2—detection process.
