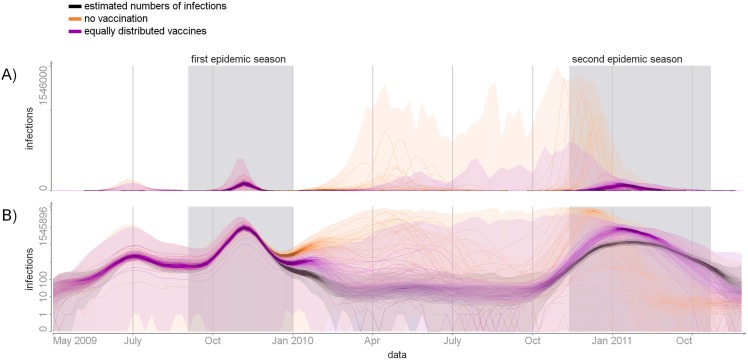
Fig 8. Simulated scenarios.
The numbers of infections per week in simulations in absolute (panel A) and log (panel B) scales. Orange colour—scenario with no vaccination. Magenta colour—scenario with vaccines equally distributed among age groups. The posterior distribution of incidence is shown in black for reference. The full probability distributions are visualized, with more probable values represented by more concentrated color. In addition, a few samples are shown.

