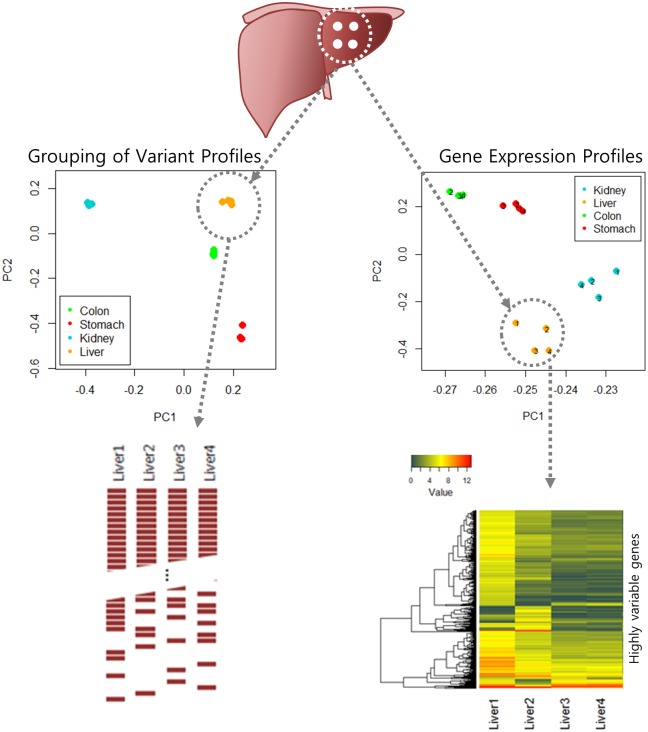
Fig 1. Schematic overview of the comparison of mutation and expression patterns from multiregion sequencing of whole-exome and whole-transcriptome.
Regional samples of each cancer were closely grouped over 2-D space based on principal component analysis (PCA). The differences in genomic variants and in gene expression between sequencing are shown.

