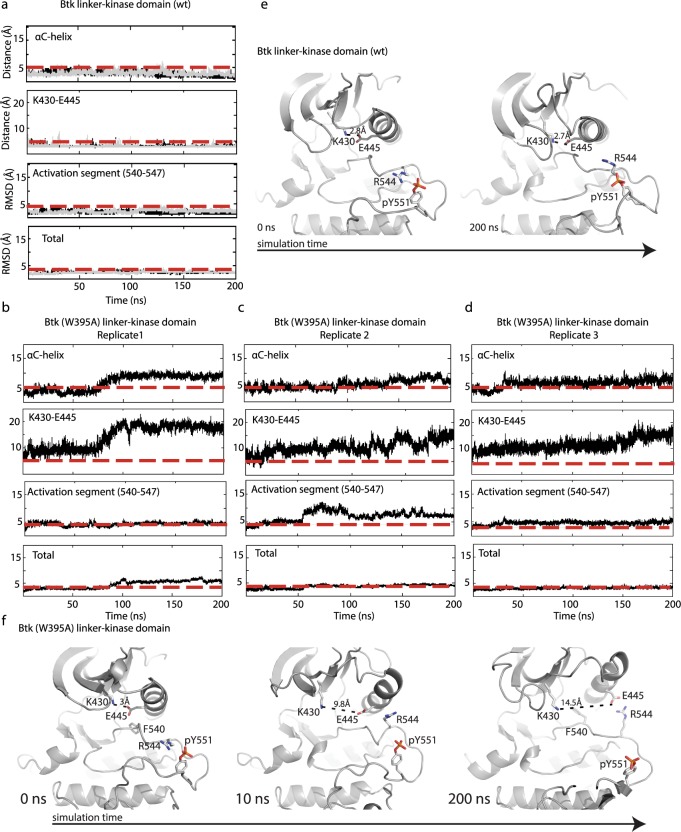
Fig 3. MD simulations of Btk linker-kinase and Btk (W395A) linker-kinase domains.
Two replicate (200 nanosecond (ns) each) equilibrium simulations (black/light grey traces) are shown for Btk linker-kinase ((a), superimposed) and three 200 ns replicates of (W395A) linker-kinase domain are shown in (b,c,d). RMSD from the starting structure is reported for the backbone atoms (total), activation segment (540–547) and αC-helix (439–451). The distance (Å) between the side-chains of K430 and E445 is shown over the course of the simulations. The red dashed lines in each plot are included for ease of comparison between mutant and wild type trajectories. (e,f) Snapshots of structures from the wild type Btk linker-kinase simulation at 0 and 200 ns (e) and from the Btk (W395A) linker-kinase simulation at 0, 10 and 200 ns (f). The wild type Btk linker-kinase domain retains the active conformation throughout the 200 ns simulation. The K430/E445 salt bridge distance is indicated and the interaction between R544 and pY551 is evident at the beginning and end of the simulation. Btk (W395A) linker-kinase domain starts in the active conformation but moves toward the inactive state as early as 10 ns. Further transition to the inactive conformation (‘C-out’) is observed as the simulation progresses and at 200 ns the K430/E445 distance is 14.5Å and R544 contacts the side chain of E445 rather than pY551. F540 is shown at 0 and 200 ns in the Btk (W395A) linker-kinase structures to illustrate the shift from the active DFG conformation to inactive.

