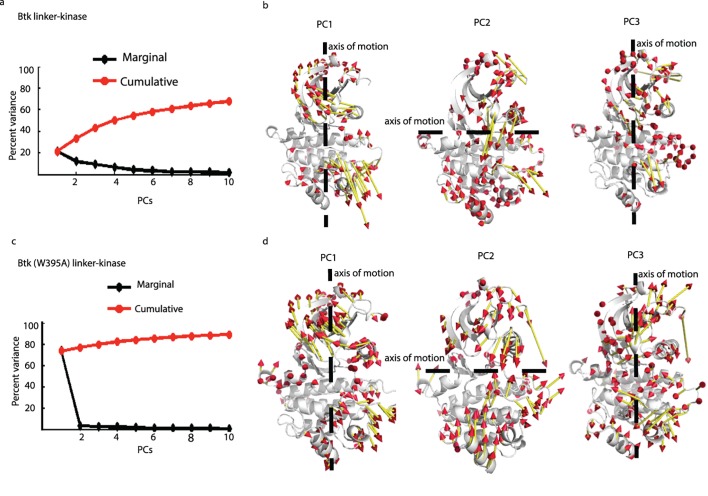
Fig 4. Principal Component Analysis.
(a,c) Percent variance captured by the first 10 PCs in Btk linker-kinase (a) and Btk (W395A) linker-kinase (c) domains. The red line is the cumulative variance captured by the PCs and the black line is the percentage of the variance captured by each individual PC. (b,d) Direction of motions in PC1, PC2 and PC3 for Btk linker-kinase (b) and Btk (W395A) linker-kinase (d) domain. Dotted lines show the axis of motion, the length of the vectors show the relative magnitudes and the arrowheads indicate the direction of motion.

