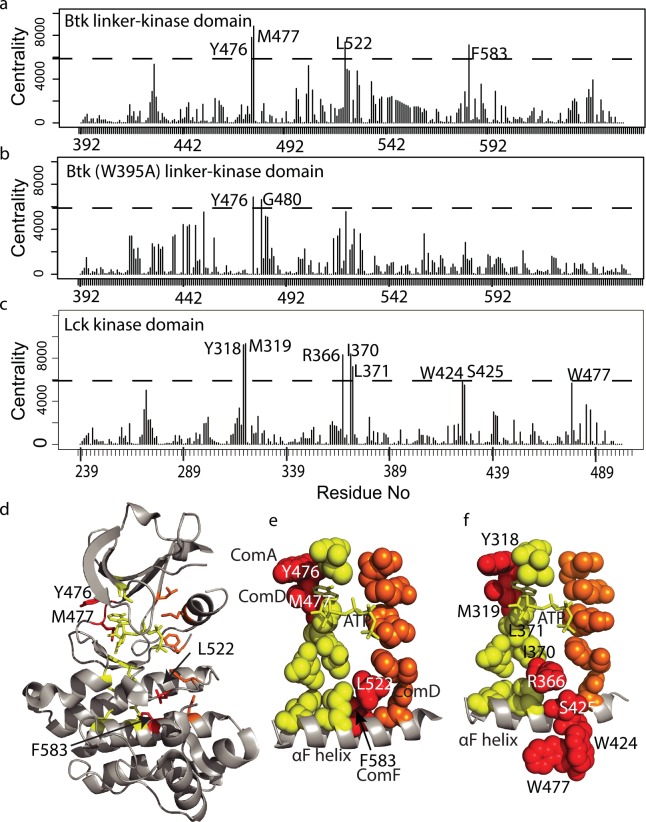
Fig 6. Node-betweenness centrality index values reveals residues that bridge the R- and C-spines.
(a-c) Node-betweenness centrality index plot for Btk linker-kinase (a), Btk (W395A) linker-kinase domains (b) and Lck kinase domain (c). The threshold (dotted line) was set for Btk linker-kinase (a), such that 98.5% of the centrality index values are below the threshold value. The same threshold is used for Btk (W395A) linker kinase in (b) and Lck in (c). In (a) and (c) the centrality value for one residue, A428 in Btk and A271 in Lck, nearly reaches the threshold but was not included in our analysis since this residue is part of the previously defined C-spine in both kinases. (d) High centrality residues from (a) are mapped onto the structure of active Btk (3K54), labeled, and colored red. C-spine residues are yellow and R-spine residues are orange as in Fig 1B. (e) Spheres define the residues of the C-spine (yellow), R-spine (orange) and the newly identified bridging residues (red). The αF-helix is shown and ATP within the C-spine is depicted in stick form. The communities (Fig 5) of each of the four bridging residues are indicated. (f) High centrality residues in Lck (shown in (c)) are mapped onto the structure of the active Lck kinase domain (3LCK), labeled and colored red. As in (e) Lck C-spine residues are yellow and R-spine residues are orange, the αF-helix is shown and ATP is shown in stick form. I370 and L371 are high centrality residues in Lck (see (c)) and are part of the previously defined C-spine and therefore colored yellow.

