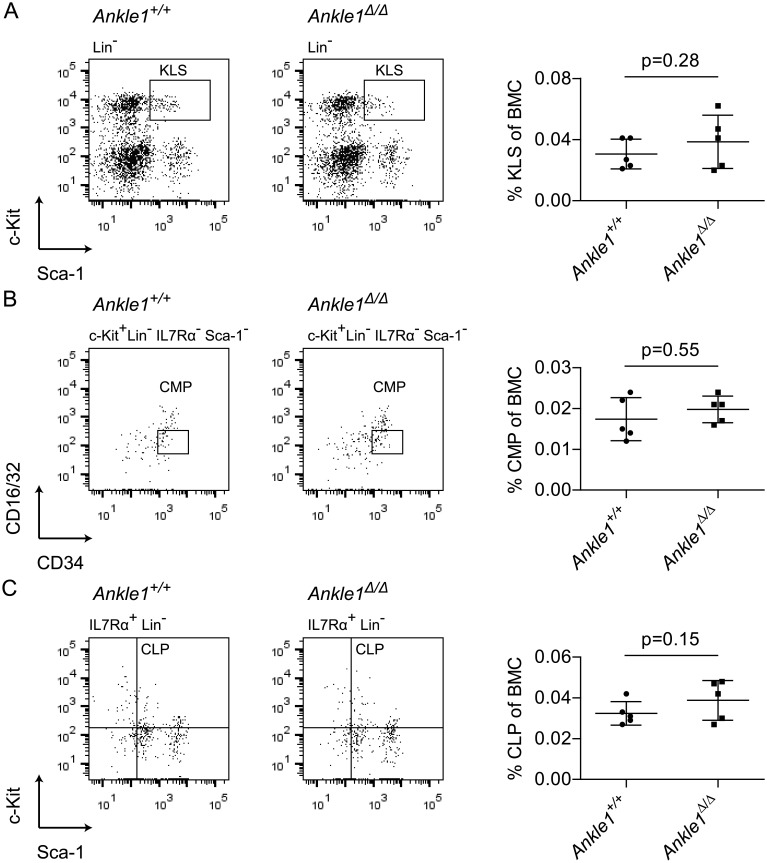
Fig 3. Flow cytometric analysis of early hematopoietic development in 9–10 months old Ankle1Δ/Δ mice.
(A) Representative dot plot of lineage negative bone marrow cells (BMCs) of an Ankle1+/+ and an Ankle1Δ/Δ mouse and relative quantification of the KLS cells (c-Kit+ and Sca-1+, boxed) depicted in a scatter plot; (B) Representative dot plot of c-Kit+ Lin- IL7Rα- Sca-1- BMCs of an Ankle1+/+ and an Ankle1Δ/Δ mouse and relative quantification of the boxed, CD16/32low CD34+ common myeloid progenitors (CMPs) in a scatter plot; (C) Representative dot plot of IL7Rα+ Lin- BMC of an Ankle1+/+ and an Ankle1Δ/Δ mouse and relative quantification of the c-Kit+ Sca-1+, common lymphoid progenitors (CLPs) depicted in a scatter plot; scatter plots indicate the mean (n = 5), error bars: standard deviation, paired students t test was used for determination of statistical significant differences (p≤0.05).

