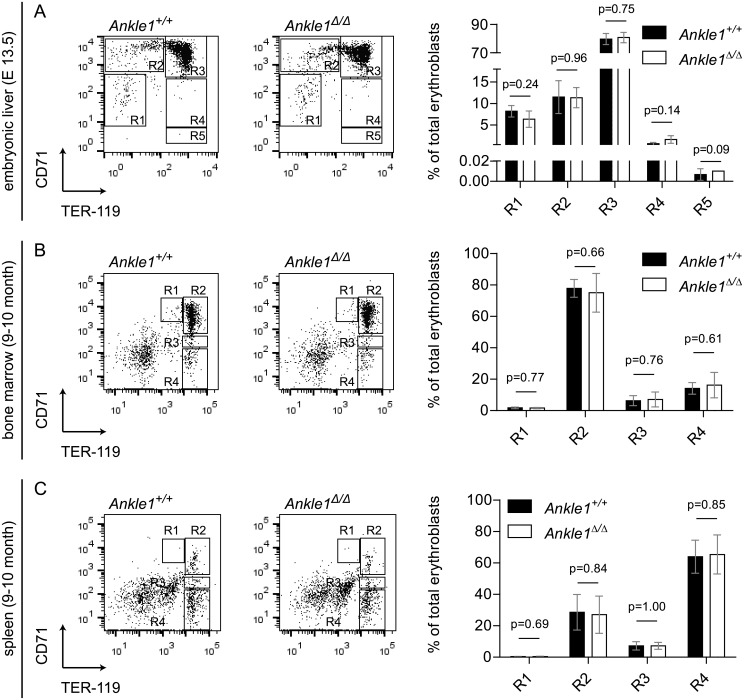
Fig 5. Flow cytometric analysis of erythroid differentiation in Ankle1Δ/Δ mice.
Cells were labeled with antibodies against Ter119 and CD71 (A) Representative dot plots of fetal liver cells from Ankle1+/+ and Ankle1Δ/Δ embryos (E 13.5), regions 1–5 (R1–R5) represent five erythroid maturation stages, bar graphs show the percentage of labeled cells in each differentiation stage, n litter = 3; Representative dot plots of (B) Bone marrow and (C) Splenic cells from an 9–10 months old Ankle1+/+ and an Ankle1Δ/Δ mouse, regions 1–4 (R1–R4) represent four erythroid maturation stages, bar graphs show the percentage of labeled cells in each differentiation stage, n = 5; error bars: standard deviation, students t test was used for determination of statistical significant differences (p≤0.05).

