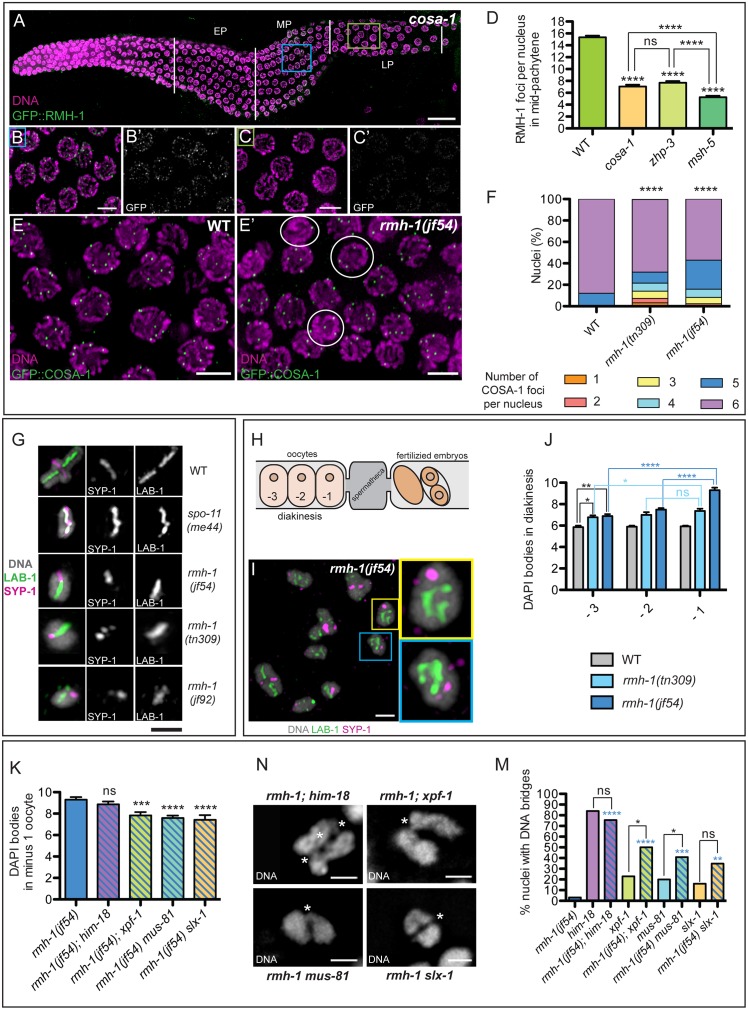
Fig 4. RMH-1 in the context of CO formation.
(A–C) RMH-1 localization in a cosa-1 mutant. In mid pachytene (MP), RMH-1 foci are less abundant and smaller than in wild-type (WT, blue square, B and B′) and are barely detectable in late pachytene (LP) (green square, C and C′). (D) Quantification of average RMH-1 foci per nucleus in MP in the WT (n = 205) and cosa-1 (n = 214), zhp-3 (n = 179), and msh-5 (n = 137) mutants. In three CO-defective mutants, foci numbers were significantly reduced (p < 0.0001). Data are represented as mean +/- SEM. (E) In WT, most LP nuclei exhibit six COSA-1::GFP foci. (E′) In rmh-1(jf54), nuclei with fewer than five COSA-1 foci (white circles) are observed. (F) Stacked bar graph showing the percentage of late pachytene nuclei containing a defined number of COSA-1 foci either in WT (n = 428) or in rmh-1(jf54) (n = 291) and rmh-1(tn309) (n = 329) mutants. Distribution of COSA-1 foci is significantly different between WT and both mutants (Mann Whitney test, **** p < 0.0001). (G) Images of individual bivalents (in WT) or univalents (in mutants) from diakinesis-stage oocytes, stained for markers that concentrate on the short arms (SYP-1) and long arms (LAB-1) of the cross-shaped bivalents in WT, reflecting differentiation of chromosome axis composition that occurs in response to nascent CO events. In spo-11(me44), SYP-1 and LAB-1 domains overlap on univalents. In contrast, some univalents in rmh-1 mutants exhibit spatially differentiated SYP-1 and LAB-1 domains, suggesting that CO sites were designated but did not mature into chiasmata. The example of rmh-1(tn309) shows that the mutual exclusion of LAB-1 and SYP-1 can be interrupted. (J) Quantification of DAPI positive structures in the -3, -2, and -1 oocytes (n = 31 for WT, n = 86 for rmh-1(tn309), and n = 91 for rmh-1(jf54)), as shown in the scheme, in which the position is defined relative to the spermatheca (H). Homologs progressively dissociate in rmh-1. Data are represented as mean +/- SEM with ns for not significant, * p < 0.05, ** p < 0.01, and **** p <0.0001. (I) rmh-1(jf54) diakinesis nucleus, showing a pair of univalents (yellow and blue squares). (K) Quantification of DAPI positive structures in the -1 oocyte. Reduced DAPI bodies in the double rmh-1(jf54); xpf-1 (p < 0.05), rmh-1(jf54) mus-81 (p < 0.001), or rmh-1(jf54) slx-1 (p < 0.01) but not rmh-1(jf54); him-18 (n = 15–36 nuclei per genotype). Data are represented as mean +/- SEM with ns for not significant, * p < 0.05, ** p < 0.01, and **** p < 0.0001. (N) DNA bridges in rmh-1(jf54); him-18, rmh-1(jf54); xpf-1, rmh-1(jf54) mus-81; and rmh-1(jf54) slx-1. (M) Quantification of diakinesis nuclei (-2 and -1) containing at least one DNA bridge between two univalents (n = 30–45 nuclei per genotype). Blue stars represent differences to rmh-1(jf54). Data are represented with **** for p < 0.001, * for p < 0.05, and ns for not significant (Chi2 test). Scale bars = 20 μm for gonads, 5 μm for nuclei, and 2 μm for bivalents or univalents.

