Figure 3.
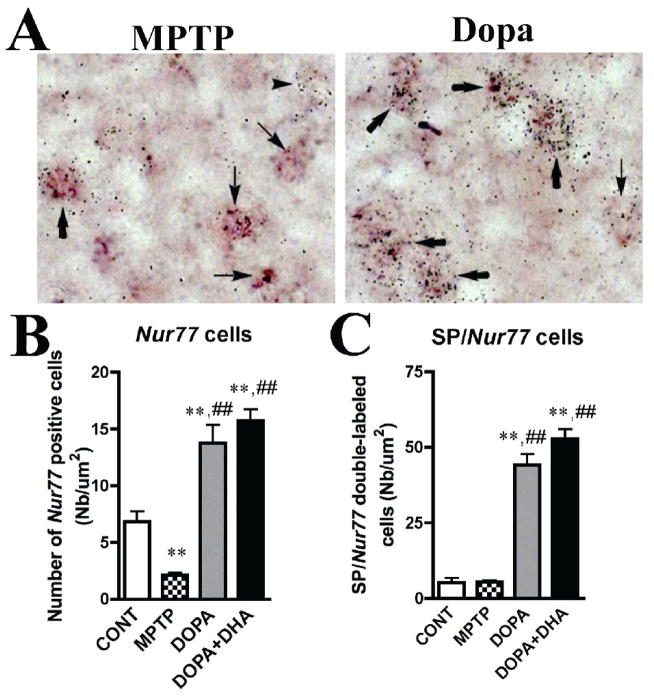
Modulation of Nur77 mRNA levels in L-Dopa-treated MPTP monkeys in substance P (SP) containing cells of the putamen. A) Representative images of the radiolabeled Nur77 mRNA probe (silver grains) and SP transcript labeled with digoxigenin (dark brown staining) in a MPTP and MPTP + L-Dopa-treated animals. Arrowheads indicate single Nur77-positive cells, thin arrows indicate single SP-positive cells and bold arrows indicate double SP/Nur77-positive cells. B) Nur77-positive cell counts in controls (CONT), MPTP, MPTP + L-Dopa and MPTP + L-Dopa + DHA-treated animals. C) SP/Nur77-double labeled cell counts in controls, MPTP, MPTP + L-Dopa and MPTP + L-Dopa + DHA-treated animals. Histogram bars represent mean cell numbers per surface unit (um2) ± SEM (N=4–5 per group) (** p < 0.01 vs CONT and ## p < 0.01 vs MPTP group). All cell counts were performed in the anterior putamen.

