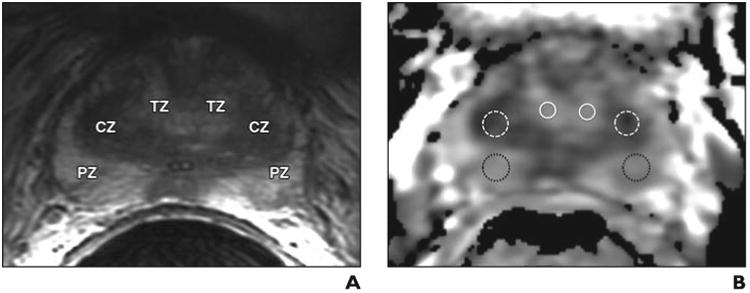
Fig. 1.

Depiction of ROI placement for calculation of mean apparent diffusion Coefficient (ADC) value.
A, Axial T2-weighted image used for anatomic delineation of histologically confirmed benign transition zone (TZ), central zone (CZ), and peripheral zone (PZ).
B, Corresponding axial ADC map with representative ROI placements in each of these zones used for calculation of mean ADC value for benign in TZ (solid white circles), CZ (dashed white circles), and PZ (dotted black circles).
